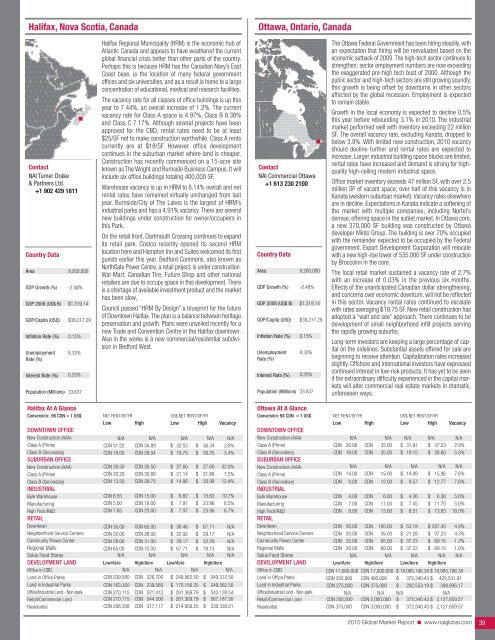
Halifax, Nova Scotia, CanadaOttawa, Ontario, CanadaContact<strong>NAI</strong> Turner Drake& Partners Ltd.+1 902 429 1811Country DataAreaGDP Growth (%)GDP 2008 (US$ B)GDP/Capita (USD)Inflation Rate (%)UnemploymentRate (%)Interest Rate (%)9,200,000-2.48%$1,319.14$39,217.290.15%8.33%0.25%Population (Millions) 33.637Halifax Regional Municipality (HRM) is the economic hub ofAtlantic Canada and appears to have weathered the currentglobal financial crisis better than other parts of the country.Perhaps this is because HRM has the Canadian Navy’s EastCoast base, is the location of many federal governmentoffices and six universities, and as a result is home to a largeconcentration of educational, medical and research facilities.The vacancy rate for all classes of office buildings is up thisyear to 7.44%, an overall increase of 1.2%. The currentvacancy rate for Class A space is 4.97%, Class B 8.38%and Class C 7.17%. Although several projects have beenapproved for the CBD, rental rates need to be at least$25/SF net to make construction worthwhile. Class A rentscurrently are at $18/SF. However, office developmentcontinues in the suburban market where land is cheaper.Construction has recently commenced on a 15-acre siteknown as The Wright and Burnside Business Campus. It willinclude six office buildings totaling 400,000 SF.Warehouse vacancy is up in HRM to 8.14% overall and netrental rates have remained virtually unchanged from lastyear. Burnside/City of The Lakes is the largest of HRM’sindustrial parks and has a 4.91% vacancy. There are severalnew buildings under construction for owner/occupiers inthis Park.On the retail front, Dartmouth Crossing continues to expandits retail park. Costco recently opened its second HRMlocation here and Hampton Inn and Suites welcomed its firstguests earlier this year. Bedford Commons, also known asNorthGate Power Centre, a retail project, is under construction.Wal-Mart, Canadian Tire, Future Shop and other nationalretailers are due to occupy space in this development. Thereis a shortage of available investment product and the markethas been slow.Council passed “HRM By Design” a blueprint for the futureof Downtown Halifax. The plan is a balance between heritagepreservation and growth. Plans were unveiled recently for anew Trade and Convention Centre in the Halifax downtown.Also in the works is a new commercial/residential subdivisionin Bedford West.Contact<strong>NAI</strong> <strong>Commercial</strong> Ottawa+1 613 230 2100Country DataAreaGDP Growth (%)GDP 2008 (US$ B)GDP/Capita (USD)Inflation Rate (%)UnemploymentRate (%)Interest Rate (%)9,200,000-2.48%$1,319.14$39,217.290.15%8.33%0.25%Population (Millions) 33.637The Ottawa Federal Government has been hiring steadily, withan expectation that hiring will be reevaluated based on theeconomic setback of 2009. The high-tech sector continues tostrengthen; sector employment numbers are now exceedingthe exaggerated pre-high tech bust of 2000. Although thepublic sector and high-tech sectors are still growing soundly,this growth is being offset by downturns in other sectorsaffected by the global recession. Employment is expectedto remain stable.Growth in the local economy is expected to decline 0.5%this year before rebounding 3.1% in <strong>2010</strong>. The industrialmarket performed well with inventory exceeding 22 millionSF. The overall vacancy rate, excluding Kanata, dropped tobelow 3.9%. With limited new construction, <strong>2010</strong> vacancyshould decline further and rental rates are expected toincrease. Larger industrial building space blocks are limited,rental rates have increased and demand is strong for highqualityhigh-ceiling modern industrial space.Office market inventory exceeds 47 million SF, with over 2.5million SF of vacant space; over half of this vacancy is inKanata (western suburban market). Vacancy rates elsewhereare in decline. Expectations in Kanata indicate a softening ofthe market with multiple companies, including Nortel’sdemise, offering space in the sublet market. In Ottawa core,a new 370,000 SF building was constructed by Ottawadeveloper Minto Group. The building is over 70% occupiedwith the remainder expected to be occupied by the Federalgovernment. Export Development Corporation will relocatewith a new high-rise tower of 535,000 SF under constructionby Broccolini in the core.The local retail market sustained a vacancy rate of 2.7%with an increase of 0.03% in the previous six months.Effects of the unanticipated Canadian dollar strengthening,and concerns over economic downturn, will not be reflectedin this sector. Vacancy rental rates continued to escalatewith rates averaging $19.75 SF. New retail construction hasadopted a “wait and see” approach. There continues to bedevelopment of small neighborhood infill projects servingthe rapidly growing suburbs.Long-term investors are keeping a large percentage of capitalon the sidelines. Substantial assets offered for sale arebeginning to receive attention. Capitalization rates increasedslightly. Offshore and international investors have expressedcontinued interest in low-risk products. It has yet to be seenif the extraordinary difficulty experienced in the capital marketswill alter commercial real estate markets in dramatic,unforeseen ways.Halifax At A GlanceConversion: .96 CDN = 1 US$ NET RENT/SF/YR US$ NET RENT/SF/YRLow High Low High VacancyDOWNTOWN OFFICENew Construction (AAA)Class A (Prime)Class B (Secondary)SUBURBAN OFFICENew Construction (AAA)Class A (Prime)Class B (Secondary)INDUSTRIALN/ACDN 31.22CDN 18.00CDN 26.50CDN 20.29CDN 13.50N/ACDN 34.89CDN 29.04CDN 26.50CDN 30.60CDN 29.75N/A$ 32.52$ 18.75$ 27.60$ 21.14$ 14.06$$$$$N/A36.3430.2527.6031.8830.99N/A2.8%3.4%32.0%7.5%12.4%Bulk WarehouseManufacturingHigh Tech/R&DRETAILCDN 6.55CDN 5.00CDN 7.65CDN 15.00CDN 16.00CDN 23.00$$$6.827.977.97$$$15.6323.9623.9610.7%6.5%6.7%DowntownNeighborhood Service CentersCommunity Power CenterRegional MallsSolus Food StoresDEVELOPMENT LANDCDN 35.00CDN 22.00CDN 28.00CDN 65.00N/ALow/AcreCDN 65.00CDN 28.00CDN 31.00CDN 75.00N/AHigh/Acre$ 36.46$ 22.92$ 29.17$ 67.71N/ALow/Acre$$$$67.7129.1732.2978.13N/AHigh/AcreN/AN/AN/AN/AN/AOffice in CBDLand in Office ParksLand in Industrial ParksOffice/Industrial Land - Non-parkRetail/<strong>Commercial</strong> LandResidentialN/A N/A N/A N/ACDN 239,580 CDN 326,700 $ 249,562.50 $ 340,312.50CDN 163,350 CDN 239,580 $ 170,156.25 $ 249,562.50CDN 270,115 CDN 521,413 $ 281,369.79 $ 543,138.54CDN 270,115 CDN 544,500 $ 281,369.79 $ 567,187.50CDN 206,358 CDN 317,117 $ 214,956.25 $ 330,330.21Ottawa At A GlanceConversion: 94 CDN = 1 US$ NET RENT/SF/YR US$ NET RENT/SF/YRLow High Low High VacancyDOWNTOWN OFFICENew Construction (AAA)N/A N/A N/A N/A N/AClass A (Prime)Class B (Secondary)SUBURBAN OFFICENew Construction (AAA)Class A (Prime)CDN 30.00CDN 18.00N/ACDN 14.00CDNCDNCDN35.0025.00N/A15.00$ 31.91$ 19.15N/A$ 14.89$$$37.2326.60N/A15.962.9%5.8%N/A7.6%Class B (Secondary)INDUSTRIALBulk WarehouseManufacturingHigh Tech/R&DRETAILCDNCDNCDNCDN9.004.007.008.00CDNCDNCDNCDN12.006.0011.0013.00$$$$9.574.267.458.51$$$$12.776.3811.7013.837.6%5.0%5.0%18.0%DowntownCDN 50.00 CDN 195.00 $ 53.19 $ 207.45 4.9%Neighborhood Service CentersCommunity Power CenterRegional MallsSolus Food StoresCDN 20.00CDN 35.00CDN 30.00N/ACDNCDNCDN35.0065.0068.00N/A$ 21.28$ 37.23$ 37.23N/A$$$37.2369.1569.15N/A4.3%1.2%1.0%N/ADEVELOPMENT LAND Low/Acre High/Acre Low/Acre High/AcreOffice in CBDLand in Office ParksLand in Industrial ParksOffice/Industrial Land - Non-parkRetail/<strong>Commercial</strong> LandResidentialCDN 17,000,000 CDN 17,000,000 $ 18,085,106.38 $ 18,085,106.38CDN 350,000 CDN 400,000 $ 372,340.43 $ 425,531.91CDN 275,000 CDN 375,000 $ 292,553.19 $ 398,936.17N/A N/A N/A N/ACDN 350,000 CDN 2,000,000 $ 372,340.43 $ 2,127,659.57CDN 375,000 CDN 3,000,000 $ 372,340.43 $ 2,127,659.57<strong>2010</strong> <strong>Global</strong> <strong>Market</strong> <strong>Report</strong> ■ www.naiglobal.com 39
Toronto, Ontario, CanadaMontreal, Quebec, CanadaContact<strong>NAI</strong> Ashlar Urban+1 416 205 9222Country DataAreaGDP Growth (%)GDP 2009 (US$ B)GDP/Capita (USD)Inflation Rate (%)9,200,000-2.48%$1,319.14$39,217.290.15%Toronto is North America’s fifth largest city and Canada’slargest economic center. With a population of approximately5.5 million people, Toronto is home to one-sixth of Canada’sworkforce. As Canada’s center for commerce, Toronto isthe hub of the banking and investment community andalso acts as the gateway for other major industries inCanada including, medical, film, tourism, fashion, food andinformation technology.Toronto’s downtown office market fundamentals continueto reflect the current economic condition with the availabilityrate remaining at approximately 10%, up from 6.9% in2008. Of note, the downtown financial core will see adramatic increase in inventory with the addition of just over3 million SF expected to come online by the end of 2009.These new completions, which include the Bay AdelaideCentre, Maple Leaf Square, RBC Centre and the Telus Tower,will consist primarily of tenants who have relocated fromwithin the downtown core.With the availability of new back-fill space, we expect anincrease in the vacancy rate in the downtown financial core.Not withstanding the softening of net rents in the financialcore, the downtown east and west markets have fared comparativelywell as lower occupancy costs and strong demandhave helped keep vacancy rates stable.Toronto has remained very forward thinking in terms of itsenvironmental standards. All major new developments scheduledfor the next 24 months have been registered for LEEDcertification, and smaller developments are starting to bringa new generation of “green buildings” to the market. Newenergy alternatives such as deep lake water cooling, havebeen embraced by some of the major new developments(Telus Tower and RBC Centre) in Toronto. A chief objective ofthe city of Toronto is to have 80% of the downtown areaserviced by Enwave by 2050.Contact<strong>NAI</strong> <strong>Commercial</strong>Montreal+1 514 866 3333Country DataAreaGDP Growth (%)GDP 2009 (US$ B)GDP/Capita (USD)Inflation Rate (%)9,200,000-2.48%$1,319.14$39,217.290.15%Enjoying a strategic position within North America, Montrealis a genuine international business center, one that forms abridge between the economy of the European Union andthat of the US. Montreal has not suffered excessively fromthe worldwide recession that dominated the market in 2009.Classed among the 20 largest cities in North America, itappears that Montreal is a city that has been able to weatherthe crisis without incurring too much damage.The city of Montreal is ranked second in North America withrespect to jobs related to the design and production of videogames. The city is also a major center for corporationsoperating in the aerospace, pharmaceutical and biotechnologyfields, and a leader in electronic commerce, multimediaproduction and information technology. The film industryalso continues to experience interesting growth in Montreal.The market for office space in the greater Montreal arearepresents more than 21% of the entire Canadian market.The total inventory in this market is more than 72 millionSF, 60% of which is in the downtown core. The overall officevacancy rate is 8%. No large projects have been startedduring this period, but in both Laval and the South Shore,situated adjacent to Montreal, several building projects havebeen developed.The hotel sector in Montreal continues to develop, withseveral new projects under way. There is approximately326.5 million SF of leasable industrial space in the greaterMontreal area. The vacancy rate in the industrial sector is7%. The majority of unoccupied space is found in olderbuildings with lower headroom, with more recent buildingsoffering greater headroom. However, industrial developmenthas been on the slow side, keeping demand steady with theexpectation of an improvement in the world economy in <strong>2010</strong>.Montreal has made its mark this year by implementing itsBIXI program, a bicycle transportation system offering over6,000 bicycles at some 400 locations in the downtown coreand adjacent suburbs. This innovative project is now beingexported to other major cities such as London and Boston.UnemploymentRate (%)8.33%UnemploymentRate (%)8.33%Interest Rate (%)0.25%Interest Rate (%)0.25%Population (Millions)33.637Population (Millions)33.637Toronto At A GlanceConversion: .96 CDN = 1 US$ NET RENT/SF/YR US$ NET RENT/SF/YRLow High Low High VacancyDOWNTOWN OFFICENew Construction (AAA)Class A (Prime)Class B (Secondary)SUBURBAN OFFICENew Construction (AAA)Class A (Prime)Class B (Secondary)INDUSTRIALCDN 28.00CDN 25.00CDN 15.00CDN 12.00N/AN/ACDNCDNCDNCDN40.0032.0025.0016.00N/AN/A$ 29.17$ 26.04$ 15.63$ 12.50N/AN/A$$$$41.6733.3326.0416.67N/AN/A9.7%9.8%7.5%9.0%N/AN/ABulk WarehouseManufacturingHigh Tech/R&DRETAILCDN 4.00N/AN/ACDN 6.50N/AN/A$ 4.17N/AN/A$ 6.77N/AN/A9.0%N/AN/ADowntownNeighborhood Service CentersCommunity Power CenterRegional MallsSolus Food StoresCDN 30.00N/AN/AN/AN/ACDN 130.00N/AN/AN/AN/A$ 31.25N/AN/AN/AN/A$ 135.42N/AN/AN/AN/A10.0%N/AN/AN/AN/ADEVELOPMENT LAND Low/Acre High/Acre Low/Acre High/AcreOffice in CBDLand in Office ParksLand in Industrial ParksOffice/Industrial Land - Non-parkRetail/<strong>Commercial</strong> LandResidentialN/A N/A N/A N/AN/A N/A N/A N/AN/A N/A N/A N/AN/A N/A N/A N/AN/A N/A N/A N/AN/A N/A N/A N/AMontreal At A GlanceConversion: .96 CDN = 1 US$ NET RENT/SF/YR US$ NET RENT/SF/YRLow High Low High VacancyDOWNTOWN OFFICENew Construction (AAA)CDN 28.50 CDN 55.00 $ 29.69 $ 57.29 6.8%Class A (Prime)CDN 35.00 CDN 42.00 $ 36.46 $ 43.75 7.2%Class B (Secondary)SUBURBAN OFFICENew Construction (AAA)Class A (Prime)Class B (Secondary)INDUSTRIALCDN 12.00N/ACDN 25.00CDN 15.00CDNCDNCDN20.00N/A31.0020.00$ 12.50N/A$ 26.04$ 15.63$$$20.83N/A32.2920.837.6%11.0%11.5%N/ABulk WarehouseManufacturingHigh Tech/R&DRETAILCDNCDNCDN4.754.255.75CDN 6.50CDN 6.00CDN 7.25$$$4.954.435.99$$$6.776.257.556.0%6.5%7.0%DowntownCDN 45.00 CDN 200.00 $ 46.88 $ 208.33 5.0%Neighborhood Service CentersCommunity Power CenterRegional MallsSolus Food StoresCDN 13.00CDN 22.00CDN 30.00N/ACDNCDNCDN25.0032.0055.00N/A$ 13.54$ 22.92$ 31.25N/A$$$26.0433.3357.29N/A6.5%3.5%6.0%N/ADEVELOPMENT LAND Low/Acre High/Acre Low/Acre High/AcreOffice in CBDLand in Office ParksLand in Industrial ParksOffice/Industrial Land - Non-parkRetail/<strong>Commercial</strong> LandResidentialCDN 6.50 CDN 15.00 $ 6.77 $ 15.63CDN 5.50 CDN 15.00 $ 5.73 $ 15.63CDN 4.50 CDN 14.00 $ 4.69 $ 14.58CDN 4.50 CDN 15.00 $ 4.69 $ 15.63CDN 8.00 CDN 15.00 $ 8.33 $ 15.63CDN 6.00 CDN 28.00 $ 6.25 $ 29.17<strong>2010</strong> <strong>Global</strong> <strong>Market</strong> <strong>Report</strong> ■ www.naiglobal.com 40
- Page 1 and 2: CommercialCommercial Real Estate Se
- Page 3 and 4: ■ ■ ■ Table of ContentsGENERA
- Page 5 and 6: Global OutlookCommercial real estat
- Page 7 and 8: 38.3% in November 2009. At the same
- Page 9 and 10: quality than the Census properties.
- Page 11 and 12: SaskatchewanSaskatchewan is a small
- Page 13 and 14: As 2009 draws to a close, there is
- Page 15 and 16: Global investment interest largely
- Page 18 and 19: ChinaChina continued to post large
- Page 20 and 21: MalaysiaWith Malaysia’s dependenc
- Page 22 and 23: ■ US Highlights - Northeast Regio
- Page 24 and 25: ■ US Highlights - Midwest Region
- Page 26 and 27: ■ US Highlights - West Region■
- Page 28 and 29: Melbourne, AustraliaBeijing, ChinaC
- Page 30 and 31: Shanghai, ChinaXiamen, ChinaContact
- Page 32 and 33: Delhi, Gurgaon, IndiaHyderabad, Pra
- Page 34 and 35: Punjab, IndiaTokyo, JapanContactNAI
- Page 36 and 37: Seoul, South KoreaTaipei, TaiwanCon
- Page 38 and 39: Calgary, Alberta, CanadaEdmonton, A
- Page 42 and 43: Regina, Saskatchewan, CanadaContact
- Page 44 and 45: Vienna, AustriaThe Baltics (Latvia/
- Page 46 and 47: Copenhagen, DenmarkFinlandContactNA
- Page 48 and 49: Athens, GreeceReykjavik IcelandCont
- Page 50 and 51: KuwaitOslo, NorwayContactNAI Kuwait
- Page 52 and 53: Moscow, Russian FederationSt. Peter
- Page 54 and 55: Madrid, SpainStockholm, SwedenConta
- Page 56 and 57: Istanbul, TurkeyKiev, UkraineContac
- Page 58 and 59: Latin AmericaSECTION CONTENTSBuenos
- Page 60 and 61: Campinas, BrazilCuritiba, BrazilCon
- Page 62 and 63: Sao Paulo, BrazilSantiago, ChileCon
- Page 64 and 65: Ciudad Juarez, Chihuahua, MexicoGua
- Page 66 and 67: Matamoros, Tamaulipas, MexicoMexica
- Page 68 and 69: Reynosa, MexicoSaltillo, Coahuila,
- Page 70 and 71: Torreon, Coahulia, MexicoCaracas, V
- Page 72 and 73: Birmingham, AlabamaHuntsville, Deca
- Page 74 and 75: Jonesboro, ArkansasLittle Rock, Ark
- Page 76 and 77: Marin County, CaliforniaMonterey, C
- Page 78 and 79: Sacramento, CaliforniaSan Diego, Ca
- Page 80 and 81: Santa Clara County (Silicon Valley)
- Page 82 and 83: Colorado Springs, ColoradoDenver, C
- Page 84 and 85: Fort Lauderdale, FloridaFt. Myers/N
- Page 86 and 87: Miami, FloridaOrlando, FloridaConta
- Page 88 and 89: Atlanta, GeorgiaHonolulu, HawaiiCon
- Page 90 and 91:
Chicago, IllinoisSpringfield, Illin
- Page 92 and 93:
Cedar Rapids, Iowa City, IowaDavenp
- Page 94 and 95:
Wichita, KansasLexington, KentuckyC
- Page 96 and 97:
Monroe, LouisianaNew Orleans, Louis
- Page 98 and 99:
Suburban MarylandBoston, Massachuse
- Page 100 and 101:
Grand Rapids, MichiganLansing, Mich
- Page 102 and 103:
St. Louis, MissouriBozeman, Montana
- Page 104 and 105:
Omaha, NebraskaLas Vegas, NevadaCon
- Page 106 and 107:
Portsmouth, New HampshireAtlantic C
- Page 108 and 109:
Ocean/Monmouth Counties (“Shore M
- Page 110 and 111:
Las Cruces, New MexicoAlbany, New Y
- Page 112 and 113:
Asheville, North CarolinaCharlotte,
- Page 114 and 115:
Fargo, North DakotaAkron, OhioConta
- Page 116 and 117:
Cleveland, OhioColumbus, OhioContac
- Page 118 and 119:
Tulsa, OklahomaPortland, OregonCont
- Page 120 and 121:
Bucks County, PennsylvaniaHarrisbur
- Page 122 and 123:
Pittsburgh, PennsylvaniaSchuylkill
- Page 124 and 125:
Greenville/Spartanburg/Anderson Cou
- Page 126 and 127:
Knoxville, TennesseeMemphis, Tennes
- Page 128 and 129:
Beaumont, TexasCorpus Christi, Texa
- Page 130 and 131:
Fort Worth, TexasHouston, TexasCont
- Page 132 and 133:
Texarkana (Bowie County, Texas/Mill
- Page 134 and 135:
Northern VirginiaSeattle/Puget Soun
- Page 136 and 137:
Madison, WisconsinMilwaukee, Wiscon
- Page 138 and 139:
Jackson Hole, WyomingContactNAI Jac
- Page 140:
Build on the power of our network.N


