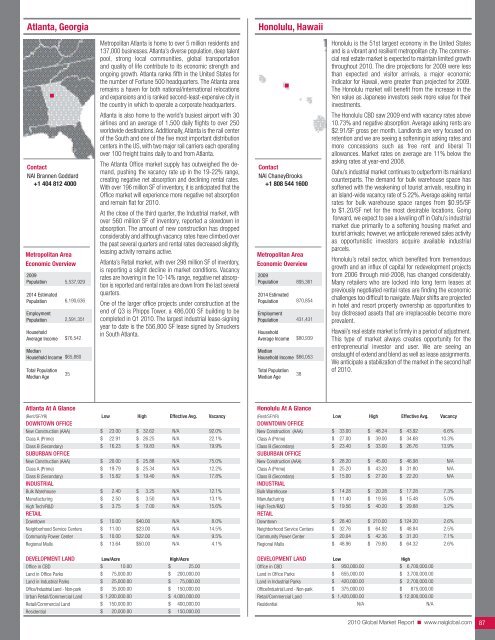
Atlanta, GeorgiaHonolulu, HawaiiContact<strong>NAI</strong> Brannen Goddard+1 404 812 4000Metropolitan AreaEconomic Overview2009Population2014 EstimatedPopulationEmploymentPopulationHouseholdAverage IncomeMedianHousehold IncomeTotal PopulationMedian Age5,537,9296,190,6362,591,351$76,542$65,88035Metropolitan Atlanta is home to over 5 million residents and137,000 businesses. Atlanta’s diverse population, deep talentpool, strong local communities, global transportationand quality of life contribute to its economic strength andongoing growth. Atlanta ranks fifth in the United States forthe number of Fortune 500 headquarters. The Atlanta arearemains a haven for both national/international relocationsand expansions and is ranked second-least-expensive city inthe country in which to operate a corporate headquarters.Atlanta is also home to the world’s busiest airport with 30airlines and an average of 1,500 daily flights to over 250worldwide destinations. Additionally, Atlanta is the rail centerof the South and one of the five most important distributioncenters in the US, with two major rail carriers each operatingover 100 freight trains daily to and from Atlanta.The Atlanta Office market supply has outweighed the demand,pushing the vacancy rate up in the 19-22% range,creating negative net absorption and declining rental rates.With over 196 million SF of inventory, it is anticipated that theOffice market will experience more negative net absorptionand remain flat for <strong>2010</strong>.At the close of the third quarter, the Industrial market, withover 560 million SF of inventory, reported a slowdown inabsorption. The amount of new construction has droppedconsiderably and although vacancy rates have climbed overthe past several quarters and rental rates decreased slightly,leasing activity remains active.Atlanta’s Retail market, with over 298 million SF of inventory,is reporting a slight decline in market conditions. Vacancyrates are hovering in the 10-14% range, negative net absorptionis reported and rental rates are down from the last severalquarters.One of the larger office projects under construction at theend of Q3 is Phipps Tower, a 486,000 SF building to becompleted in Q1 <strong>2010</strong>. The largest industrial lease-signingyear to date is the 556,800 SF lease signed by Smuckersin South Atlanta.Contact<strong>NAI</strong> ChaneyBrooks+1 808 544 1600Metropolitan AreaEconomic Overview2009Population2014 EstimatedPopulationEmploymentPopulationHouseholdAverage IncomeMedianHousehold IncomeTotal PopulationMedian Age895,361870,854431,431$80,939$66,05338Honolulu is the 51st largest economy in the United Statesand is a vibrant and resilient metropolitan city. The commercialreal estate market is expected to maintain limited growththroughout <strong>2010</strong>. The dire projections for 2009 were lessthan expected and visitor arrivals, a major economicindicator for Hawaii, were greater than projected for 2009.The Honolulu market will benefit from the increase in theYen value as Japanese investors seek more value for theirinvestments.The Honolulu CBD saw 2009 end with vacancy rates above10.73% and negative absorption. Average asking rents are$2.91/SF gross per month. Landlords are very focused onretention and we are seeing a softening in asking rates andmore concessions such as free rent and liberal TIallowances. <strong>Market</strong> rates on average are 11% below theasking rates at year-end 2008.Oahu’s industrial market continues to outperform its mainlandcounterparts. The demand for bulk warehouse space hassoftened with the weakening of tourist arrivals, resulting inan island-wide vacancy rate of 5.22%. Average asking rentalrates for bulk warehouse space ranges from $0.95/SFto $1.20/SF net for the most desirable locations. Goingforward, we expect to see a leveling off in Oahu’s industrialmarket due primarily to a softening housing market andtourist arrivals; however, we anticipate renewed sales activityas opportunistic investors acquire available industrialparcels.Honolulu’s retail sector, which benefited from tremendousgrowth and an influx of capital for redevelopment projectsfrom 2006 through mid-2008, has changed considerably.Many retailers who are locked into long term leases atpreviously negotiated rental rates are finding the economicchallenges too difficult to navigate. Major shifts are projectedin hotel and resort property ownership as opportunities tobuy distressed assets that are irreplaceable become moreprevalent.Hawaii’s real estate market is firmly in a period of adjustment.This type of market always creates opportunity for theentrepreneurial investor and user. We are seeing anonslaught of extend and blend as well as lease assignments.We anticipate a stabilization of the market in the second halfof <strong>2010</strong>.Atlanta At A Glance(Rent/SF/YR) Low High Effective Avg. VacancyDOWNTOWN OFFICENew Construction (AAA)Class A (Prime)Class B (Secondary)SUBURBAN OFFICENew Construction (AAA)Class A (Prime)Class B (Secondary)INDUSTRIALBulk WarehouseManufacturingHigh Tech/R&DRETAIL$$$$$$$$$23.0022.9116.2320.0019.7915.822.402.503.75$$$$$$$$$32.6226.2519.8325.8825.3419.403.253.507.00N/AN/AN/AN/AN/AN/AN/AN/AN/A92.0%22.1%19.9%75.0%12.2%17.8%12.1%13.1%15.6%DowntownNeighborhood Service CentersCommunity Power CenterRegional Malls$$$$10.0011.0010.0013.64$40.00$23.00$22.00$50.00N/AN/AN/AN/A8.0%14.5%9.5%4.1%DEVELOPMENT LAND Low/Acre High/AcreOffice in CBDLand in Office ParksLand in Industrial ParksOffice/Industrial Land - Non-park$$$$10.0075,000.0025,000.0035,000.00$$$$25.00200,000.0075,000.00150,000.00Urban Retail/<strong>Commercial</strong> Land $ 1,200,000.00 $ 4,000,000.00Retail/<strong>Commercial</strong> LandResidential$$150,000.0020,000.00$$400,000.00150,000.00Honolulu At A Glance(Rent/SF/YR) Low High Effective Avg. VacancyDOWNTOWN OFFICENew Construction (AAA)Class A (Prime)Class B (Secondary)SUBURBAN OFFICENew Construction (AAA)Class A (Prime)Class B (Secondary)INDUSTRIALBulk WarehouseManufacturingHigh Tech/R&DRETAIL$$$$$$$$$33.0027.0023.4028.2025.2015.0014.2811.4019.56$$$$$$$$$48.2439.0033.0045.0043.2027.0020.2819.5640.20$$$$$$$$$43.9234.6826.7646.9831.8022.2017.2815.4829.886.6%10.3%13.9%N/AN/AN/A7.3%5.0%3.2%Downtown$ 28.40 $ 210.00 $ 124.20 2.6%Neighborhood Service CentersCommunity Power CenterRegional Malls$$$32.7620.0448.96$$$64.9242.3679.80$$$48.8431.2064.322.5%7.1%2.6%DEVELOPMENT LAND Low HighOffice in CBDLand in Office ParksLand in Industrial ParksOffice/Industrial Land - Non-parkRetail/<strong>Commercial</strong> LandResidential$ 950,000.00 $ 6,700,000.00$ 655,000.00 $ 3,700,000.00$ 420,000.00 $ 2,700,000.00$ 375,000.00 $ 875,000.00$ 1,420,000.00 $ 12,000,000.00N/AN/A<strong>2010</strong> <strong>Global</strong> <strong>Market</strong> <strong>Report</strong> ■ www.naiglobal.com 87
Boise, IdahoSoutheast (Idaho Falls/Pocatello), IdahoContact<strong>NAI</strong> Pinnacle+1 208 947 0019Metropolitan AreaEconomic Overview2009Population2014 EstimatedPopulationEmploymentPopulationHouseholdAverage IncomeMedianHousehold Income631,645740,193306,935$66,650$53,925<strong>Commercial</strong> <strong>Real</strong> <strong>Estate</strong> in the Boise Metropolitan areaexperienced high vacancy rates and decreasing lease rates.Unemployment has risen but is still below the nationalaverage. The high-tech sector has stabilized and mayincrease in <strong>2010</strong>. Boise’s health care sector is growingalong with alternative energy. Retail, office and industrial aredown. Residential development has stopped. Much neededhighway work is providing economic stimulus to the area.Boise is still rated one of the best areas in the country tolive, work and start a business (Forbes), as reflected by thedramatic increase of company inquiries. With an educated,employable workforce, Boise State University and a greatquality of life, we see an upswing occurring in all markets in<strong>2010</strong> except residential development. The industrial sectorhas been hit hard and vacancy rates have reached 11%.Lease rates are similar to the mid 1990s at around $0.32to $0.48/SF.Vacancy in the office sector is continuing to rise with anoverall 19.5% vacancy rate. Vacancy rates throughout thesubmarkets are ranging from 7.5% vacancy Downtown toover 25% in the Southwest Boise market. New constructionand owner occupied sales are down more than 50% fromlast year. Multifamily vacancies are under 8%, reflecting anincreasing market sector. Fully leased investment propertiesare still hard to find and when found carry capitalizationrates equivalent to national norms of mid 7% to high 8%.Retail is still location specific. An overall vacancy rate of 14%represents an increase over 2008. The big box retailers thatclosed are replaced by retailers new to the area, whichspeaks well for the vibrancy of the Boise Metropolitan Area.Owners in all sectors will continue to offer aggressiveconcessions such as free rent, lower rates, and increasedTI allowances.The Boise Metropolitan Area is once again poised to grow in<strong>2010</strong> driven by new jobs from relocated companies. Retailand industrial sectors will increase first, followed by officeand residential. Quality of life will still be our driving forcefor <strong>2010</strong>.Contact<strong>NAI</strong> Commerce One <strong>Real</strong><strong>Estate</strong>, LLC+1 208 525 8088Metropolitan AreaEconomic Overview2008Population2013 EstimatedPopulationEmploymentPopulationHouseholdAverage IncomeMedianHousehold Income122,265134,83855,247$56,740$52,207Eastern Idaho is uniquely positioned to continue its steadygrowth and weather the economic storms facing the nation,with an economy fueled by a well-educated workforce,energy, medical technologies, agribusiness and tourism. InIdaho Falls, the strategically located 400-acre Snake RiverLanding development opened its Central Valley, an integralpart of the master-planned community that includes over 30acres of green space, walking paths, cascading waterfallsand a 3.65-acre lake.Plentiful recreation opportunities abound in the area, alongwith easy access to world famous destinations like JacksonHole, Grand Targhee and Yellowstone. Pocatello is a strategicallylocated logistics hub that is also home to the state'spremier health research university and a variety of new retaildevelopments, including Costco. Rexburg has benefited fromthe continued expansion of BYU-Idaho, led by the formerDean of the Harvard Business School.Eastern Idaho provides an abundance of opportunities forenergy related companies, including commercialization programsbetween the Idaho National Lab and private industry,and an increasing number of research parks and incubators.The INL employs over 7,500 scientists, researchers andsupport staff, providing economic stability in the region.Idaho is one of the top four states in the nation in green jobgrowth, with eastern Idaho being very attractive due to itsvibrant business environment, low cost of living, industriousworkforce and favorable local government support. Pocatellowas selected as the location for Nordic Windpower’sNorth American manufacturing facility because of its advantageouscost of operations, excellent workforce andcentral location to potential customers and transportation.Also in Pocatello, the Hawaiian company Hoku Scientific, iscontinuing work on its $390 million polysilicon plantscheduled to be finished in <strong>2010</strong>.Areva’s $2 billion Eagle Rock uranium enrichment facility,located west of Idaho Falls, is slated for completion in 2014.According to a study by the Regional Development Alliance,the project could bring up to $5 billion in economic activityand create 5,000 direct and indirect jobs during construction.Total PopulationMedian Age34Total PopulationMedian Age32Boise At A Glance(Rent/SF/YR) Low High Effective Avg. VacancyDOWNTOWN OFFICENew Construction (AAA)Class A (Prime)Class B (Secondary)SUBURBAN OFFICENew Construction (AAA)Class A (Prime)Class B (Secondary)INDUSTRIALBulk WarehouseManufacturingHigh Tech/R&DRETAILDowntownNeighborhood Service CentersCommunity Power CenterRegional Malls$$$$$$$$$$$$$20.0016.008.0017.5012.006.002.643.725.529.007.0012.0019.00$$$$$$$$$$$$$25.0021.0014.5023.0019.5015.005.166.2412.2321.0019.0024.0028.00$$$$$$$$$$$$$23.5017.5012.0021.0014.5010.503.904.988.8816.0014.0018.0022.0010.0%5.5%7.5%15.0%18.5%21.0%11.0%5.7%15.4%8.5%25.0%10.4%8.0%DEVELOPMENT LAND Low HighOffice in CBDLand in Office ParksLand in Industrial ParksOffice/Industrial Land - Non-parkRetail/<strong>Commercial</strong> LandResidential$ 1,004,400.00 $ 1,306,578.00$ 206,910.00 $ 917,650.00$ 152,460.00 $ 315,810.00$ 128,066.00 $ 384,199.00$ 128,066.00 $ 866,844.00$ 15,900.00 $ 49,800.00Idaho Falls/Pocatello At A Glance(Rent/SF/YR) Low High Effective Avg. VacancyDOWNTOWN OFFICENew Construction (AAA)N/A N/A N/A N/AClass A (Prime)Class B (Secondary)SUBURBAN OFFICENew Construction (AAA)Class A (Prime)Class B (Secondary)INDUSTRIAL$$$16.0011.00N/AN/A10.50$$$18.0013.00N/AN/A14.00$ 17.00$ 12.00N/AN/A$ 13.0010.0%12.0%N/AN/A10.0%Bulk WarehouseManufacturingHigh Tech/R&DRETAIL$$$3.004.806.00$$$6.506.507.00$$$4.506.007.005.0%5.0%5.0%DowntownNeighborhood Service CentersCommunity Power CenterRegional Malls$$$$9.0011.009.0028.00$$$$12.0028.0017.0040.00$ 10.00$ 16.00$ 15.00$ 32.0018.0%14.0%18.0%2.0%DEVELOPMENT LAND Low/Acre High/AcreOffice in CBDLand in Office ParksLand in Industrial ParksOffice/Industrial Land - Non-parkRetail/<strong>Commercial</strong> LandResidential$$$$$$217,000.00217,000.0075,000.0040,000.00150,000.0015,000.00$$$$$$435,000.00435,000.00150,000.00150,000.00650,000.00100,000.00<strong>2010</strong> <strong>Global</strong> <strong>Market</strong> <strong>Report</strong> ■ www.naiglobal.com 88
- Page 1 and 2:
CommercialCommercial Real Estate Se
- Page 3 and 4:
■ ■ ■ Table of ContentsGENERA
- Page 5 and 6:
Global OutlookCommercial real estat
- Page 7 and 8:
38.3% in November 2009. At the same
- Page 9 and 10:
quality than the Census properties.
- Page 11 and 12:
SaskatchewanSaskatchewan is a small
- Page 13 and 14:
As 2009 draws to a close, there is
- Page 15 and 16:
Global investment interest largely
- Page 18 and 19:
ChinaChina continued to post large
- Page 20 and 21:
MalaysiaWith Malaysia’s dependenc
- Page 22 and 23:
■ US Highlights - Northeast Regio
- Page 24 and 25:
■ US Highlights - Midwest Region
- Page 26 and 27:
■ US Highlights - West Region■
- Page 28 and 29:
Melbourne, AustraliaBeijing, ChinaC
- Page 30 and 31:
Shanghai, ChinaXiamen, ChinaContact
- Page 32 and 33:
Delhi, Gurgaon, IndiaHyderabad, Pra
- Page 34 and 35:
Punjab, IndiaTokyo, JapanContactNAI
- Page 36 and 37:
Seoul, South KoreaTaipei, TaiwanCon
- Page 38 and 39: Calgary, Alberta, CanadaEdmonton, A
- Page 40 and 41: Halifax, Nova Scotia, CanadaOttawa,
- Page 42 and 43: Regina, Saskatchewan, CanadaContact
- Page 44 and 45: Vienna, AustriaThe Baltics (Latvia/
- Page 46 and 47: Copenhagen, DenmarkFinlandContactNA
- Page 48 and 49: Athens, GreeceReykjavik IcelandCont
- Page 50 and 51: KuwaitOslo, NorwayContactNAI Kuwait
- Page 52 and 53: Moscow, Russian FederationSt. Peter
- Page 54 and 55: Madrid, SpainStockholm, SwedenConta
- Page 56 and 57: Istanbul, TurkeyKiev, UkraineContac
- Page 58 and 59: Latin AmericaSECTION CONTENTSBuenos
- Page 60 and 61: Campinas, BrazilCuritiba, BrazilCon
- Page 62 and 63: Sao Paulo, BrazilSantiago, ChileCon
- Page 64 and 65: Ciudad Juarez, Chihuahua, MexicoGua
- Page 66 and 67: Matamoros, Tamaulipas, MexicoMexica
- Page 68 and 69: Reynosa, MexicoSaltillo, Coahuila,
- Page 70 and 71: Torreon, Coahulia, MexicoCaracas, V
- Page 72 and 73: Birmingham, AlabamaHuntsville, Deca
- Page 74 and 75: Jonesboro, ArkansasLittle Rock, Ark
- Page 76 and 77: Marin County, CaliforniaMonterey, C
- Page 78 and 79: Sacramento, CaliforniaSan Diego, Ca
- Page 80 and 81: Santa Clara County (Silicon Valley)
- Page 82 and 83: Colorado Springs, ColoradoDenver, C
- Page 84 and 85: Fort Lauderdale, FloridaFt. Myers/N
- Page 86 and 87: Miami, FloridaOrlando, FloridaConta
- Page 90 and 91: Chicago, IllinoisSpringfield, Illin
- Page 92 and 93: Cedar Rapids, Iowa City, IowaDavenp
- Page 94 and 95: Wichita, KansasLexington, KentuckyC
- Page 96 and 97: Monroe, LouisianaNew Orleans, Louis
- Page 98 and 99: Suburban MarylandBoston, Massachuse
- Page 100 and 101: Grand Rapids, MichiganLansing, Mich
- Page 102 and 103: St. Louis, MissouriBozeman, Montana
- Page 104 and 105: Omaha, NebraskaLas Vegas, NevadaCon
- Page 106 and 107: Portsmouth, New HampshireAtlantic C
- Page 108 and 109: Ocean/Monmouth Counties (“Shore M
- Page 110 and 111: Las Cruces, New MexicoAlbany, New Y
- Page 112 and 113: Asheville, North CarolinaCharlotte,
- Page 114 and 115: Fargo, North DakotaAkron, OhioConta
- Page 116 and 117: Cleveland, OhioColumbus, OhioContac
- Page 118 and 119: Tulsa, OklahomaPortland, OregonCont
- Page 120 and 121: Bucks County, PennsylvaniaHarrisbur
- Page 122 and 123: Pittsburgh, PennsylvaniaSchuylkill
- Page 124 and 125: Greenville/Spartanburg/Anderson Cou
- Page 126 and 127: Knoxville, TennesseeMemphis, Tennes
- Page 128 and 129: Beaumont, TexasCorpus Christi, Texa
- Page 130 and 131: Fort Worth, TexasHouston, TexasCont
- Page 132 and 133: Texarkana (Bowie County, Texas/Mill
- Page 134 and 135: Northern VirginiaSeattle/Puget Soun
- Page 136 and 137: Madison, WisconsinMilwaukee, Wiscon
- Page 138 and 139:
Jackson Hole, WyomingContactNAI Jac
- Page 140:
Build on the power of our network.N


