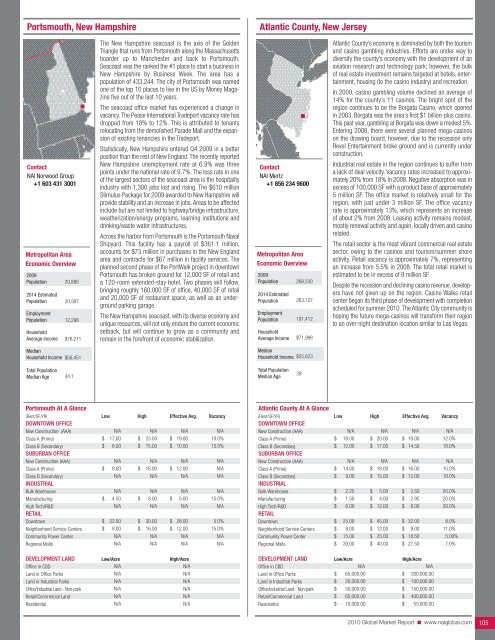
Portsmouth, New HampshireAtlantic County, New JerseyContact<strong>NAI</strong> Norwood Group+1 603 431 3001Metropolitan AreaEconomic Overview2009Population2014 EstimatedPopulationEmploymentPopulationHouseholdAverage Income20,88020,58712,298$76,211The New Hampshire seacoast is the axis of the GoldenTriangle that runs from Portsmouth along the Massachusettsboarder up to Manchester and back to Portsmouth.Seacoast was the ranked the #1 place to start a business inNew Hampshire by Business Week. The area has apopulation of 433,244. The city of Portsmouth was namedone of the top 10 places to live in the US by Money Magazinefive out of the last 10 years.The seacoast office market has experienced a change invacancy. The Pease International Tradeport vacancy rate hasdropped from 18% to 12%. This is attributed to tenantsrelocating from the demolished Parade Mall and the expansionof existing tenancies in the Tradeport.Statistically, New Hampshire entered Q4 2009 in a betterposition than the rest of New England. The recently reportedNew Hampshire unemployment rate at 6.9% was threepoints under the national rate of 9.7%. The loss rate in oneof the largest sectors of the seacoast area is the hospitalityindustry with 1,300 jobs lost and rising. The $610 millionStimulus Package for 2009 awarded to New Hampshire willprovide stability and an increase in jobs. Areas to be affectedinclude but are not limited to highway/bridge infrastructure,weatherization/energy programs, learning institutions anddrinking/waste water infrastructures.Across the harbor from Portsmouth is the Portsmouth NavalShipyard. This facility has a payroll of $361.1 million,accounts for $73 million in purchases in the New Englandarea and contracts for $67 million in facility services. Theplanned second phase of the PortWalk project in downtownPortsmouth has broken ground for 12,000 SF of retail anda 120-room extended-stay hotel. Two phases will follow,bringing roughly 160,000 SF of office, 40,000 SF of retailand 20,000 SF of restaurant space, as well as an undergroundparking garage.The New Hampshire seacoast, with its diverse economy andunique resources, will not only endure the current economicsetback, but will continue to grow as a community andremain in the forefront of economic stabilization.Contact<strong>NAI</strong> Mertz+1 856 234 9600Metropolitan AreaEconomic Overview2009Population2014 EstimatedPopulationEmploymentPopulationHouseholdAverage Income268,530263,127191,412$71,988Atlantic County’s economy is dominated by both the tourismand casino gambling industries. Efforts are under way todiversify the county’s economy with the development of anaviation research and technology park; however, the bulkof real estate investment remains targeted at hotels, entertainment,housing (to the casino industry) and recreation.In 2009, casino gambling volume declined an average of14% for the county’s 11 casinos. The bright spot of theregion continues to be the Borgata Casino, which openedin 2003. Borgata was the area’s first $1 billion-plus casino.This past year, gambling at Borgata was down a modest 5%.Entering 2008, there were several planned mega-casinoson the drawing board, however, due to the recession onlyRevel Entertainment broke ground and is currently underconstruction.Industrial real estate in the region continues to suffer froma lack of deal velocity. Vacancy rates increased to approximately20% from 18% in 2008. Negative absorption was inexcess of 100,000 SF with a product base of approximately5 million SF. The office market is relatively small for theregion, with just under 3 million SF. The office vacancyrate is approximately 13%, which represents an increaseof about 2% from 2008. Leasing activity remains modest,mostly renewal activity and again, locally driven and casinorelated.The retail sector is the most vibrant commercial real estatesector, owing to the casinos and tourism/summer shoreactivity. Retail vacancy is approximately 7%, representingan increase from 5.5% in 2008. The total retail market isestimated to be in excess of 9 million SF.Despite the recession and declining casino revenue, developershave not given up on the region. Casino Walks retailcenter began its third phase of development with completionscheduled for summer <strong>2010</strong>. The Atlantic City community ishoping the future mega-casinos will transform their regionto an over-night destination location similar to Las Vegas.MedianHousehold Income$56,451MedianHousehold Income$55,623Total PopulationMedian Age44.1Total PopulationMedian Age39Portsmouth At A Glance(Rent/SF/YR) Low High Effective Avg. VacancyDOWNTOWN OFFICENew Construction (AAA)Class A (Prime)Class B (Secondary)SUBURBAN OFFICENew Construction (AAA)Class A (Prime)Class B (Secondary)INDUSTRIALBulk WarehouseManufacturingHigh Tech/R&DRETAILDowntownNeighborhood Service CentersCommunity Power CenterRegional Malls$$$$$$N/A17.008.00N/A8.00N/AN/A4.50N/A22.008.00N/AN/A$$$$$$N/A23.0015.00N/A16.00N/AN/A8.00N/A30.0016.00N/AN/A$$$$$$N/A19.0010.00N/A12.00N/AN/A5.00N/A28.0012.00N/AN/AN/A10.0%15.0%N/AN/AN/AN/A15.0%N/A5.0%15.0%N/AN/ADEVELOPMENT LAND Low/Acre High/AcreOffice in CBDLand in Office ParksLand in Industrial ParksOffice/Industrial Land - Non-parkRetail/<strong>Commercial</strong> LandResidentialN/AN/AN/AN/AN/AN/AN/AN/AN/AN/AN/AN/AAtlantic County At A Glance(Rent/SF/YR) Low High Effective Avg. VacancyDOWNTOWN OFFICENew Construction (AAA)Class A (Prime)Class B (Secondary)SUBURBAN OFFICENew Construction (AAA)Class A (Prime)Class B (Secondary)INDUSTRIAL$$$$N/A18.0012.00N/A14.009.00$$$$N/A20.0017.00N/A18.0015.00N/A$ 19.00$ 14.50N/A$ 16.00$ 12.00N/A12.0%18.0%N/A15.0%18.0%Bulk WarehouseManufacturingHigh Tech/R&DRETAIL$$$2.251.506.00$$$5.004.0012.00$$$3.502.958.0020.0%20.0%20.0%Downtown$ 25.00 $ 45.00 $ 32.00 8.0%Neighborhood Service Centers $ 8.00 $ 12.00 $ 9.00 11.0%Community Power CenterRegional Malls$$15.0020.00$$25.0040.00$ 18.50$ 27.505.00%7.0%DEVELOPMENT LAND Low/Acre High/AcreOffice in CBDLand in Office ParksLand in Industrial ParksOffice/Industrial Land - Non-parkRetail/<strong>Commercial</strong> LandResidential$$$$$N/A65,000.0020,000.0050,000.0065,000.0010,000.00$$$$$N/A200,000.00100,000.00150,000.00400,000.0055,000.00<strong>2010</strong> <strong>Global</strong> <strong>Market</strong> <strong>Report</strong> ■ www.naiglobal.com 105
Middlesex/Somerset Counties, New JerseyNorthern New JerseyContact<strong>NAI</strong> DiLeo-Bram & Co.+1 732 985 3000Metropolitan AreaEconomic Overview2009Population2014 EstimatedPopulationEmploymentPopulationHouseholdAverage IncomeMedianHousehold Income1,114,0101,117,820550,366$103,225$83,279Middlesex and Somerset Counties are located in the heartof the central New Jersey commercial real estate market,located 40 minutes from downtown New York City and 60minutes from Philadelphia. Direct access to Newark LibertyInternational Airport, the Ports of Elizabeth and Newark,access to a public mass transit system and an excellent roadsystem attract companies wanting to take advantage of itsgeographical location and the abundant supply of a skilledand educated labor force.Office sales and leasing activity is at a near standstill asbuyers/tenants and sellers/landlords remain cautious.Renewal activity is more prevalent as companies are optingto stay in place rather than incur the costs of moving andlandlords are willing to make concessions to stabilize theirassets. The office vacancy rate has increased to 20.7% asmore sublease space continues to come onto the market.The industrial market in central New Jersey remains highlychallenged. Central New Jersey’s strength is as a regionaldistribution hub for larger big box industrial companiesservicing the retail sector. The downturn in the economy hasnegatively affected the supply provided by the optimisticspeculative construction that took place in the past 10 years.The submarket located at exit 8A on the NJ Turnpike hasbeen especially hit hard as the vacancy rate has hit almost20% and rents have dropped 30-35% to rates not seen in20 years.The retail market in central New Jersey remains relativelystable. A handful of national retailers have gone bankruptand many retailers continue to struggle. The vacancy ratehas risen from 3% to 9% in the region. Rents have stabilizedor dropped and new construction is non-existent. Thebiggest hurdle will be who will replace the big box retailersthat have exited.Tenants will continue to take advantage of the current marketconditions as investors wait on the sidelines for opportunitiesto emerge on mortgages coming due for properties thatwere overleveraged at reduced capitalization rates. Oncethe market stabilizes and space is absorbed the region willagain be primed for growth.Contact<strong>NAI</strong> James E. Hanson+1 201 488 5800Metropolitan AreaEconomic Overview2009Population2014 EstimatedPopulationEmploymentPopulationHouseholdAverage IncomeMedianHousehold Income3,956,44813,760,8491,996,289$103,225$83,279The market was stagnant in Q4 of 2008 into the first half of2009. Whether people focused on internal issues or waitingfor the next problem to arise, the end result was that theydelayed making decisions. This began to change midwaythrough the year. There is now more real activity and dealmaking taking place. Most of the transactions beingcompleted are relatively short term and ones where thelandlords and sellers are very aggressive.In the office market, vacancy factors are only slightly upover a year ago. However, asking rents have decreased andlandlords are very aggressive in offering free rent andextensive work letters. Subletting is also having a majorimpact on the market. The suburban markets have sufferedmore than the submarkets close to New York City.The vacancy factor in the industrial sector is approachinga 10-year high. However, there have been transactions,especially in the second half of the year. Asking rateshave decreased approximately 20% year to date and dealsare being made off of those numbers. Landlords aremaking shorter term deals more frequently than in thepast, and tenants have also been reluctant to make longterm commitments.The retail sector has experienced the most difficult marketin the past 20 years. Vacancies in major corridors that wouldnormally be leased right away are remaining vacant forextended periods of time. The sector is suffering from a lackof activity as opposed to the other sectors where there aredeals to be made at a price.Investment sales have been nearly nonexistent. There isa growing gap in value between what owners feel theirproperties are worth and what buyers are willing to pay.Additionally, there are fewer buyers in a position to purchaseproperties, and many of them are pursuing debt purchasesversus physical real estate.The first half of <strong>2010</strong> should be a continuation of the secondhalf of 2009. Leasing activity should steadily improve ascompanies begin to feel more confident in the economy,with any area of concern remaining in the debt and capitalarenas.Total PopulationMedian Age38.6Total PopulationMedian Age38.6Middlesex/Somerset Counties At A Glance(Rent/SF/YR) Low High Effective Avg. VacancyDOWNTOWN OFFICENew Construction (AAA)Class A (Prime)Class B (Secondary)SUBURBAN OFFICENew Construction (AAA)Class A (Prime)Class B (Secondary)INDUSTRIAL$$$N/AN/AN/A24.0018.0014.00$$$N/AN/AN/A29.0024.0018.00N/AN/AN/A$ 25.00$ 20.00$ 15.00N/AN/AN/A30.0%21.00%20.0%Bulk WarehouseManufacturingHigh Tech/R&DRETAIL$$$2.502.506.00$$$4.755.0012.00$$$3.503.508.0014.0%6.0%7.0%DowntownNeighborhood Service CentersCommunity Power CenterRegional Malls$$$$14.0012.0016.0030.00$$$$25.0022.0025.0060.00$ 20.00$ 17.00$ 22.00$ 50.008.0%10.0%10.0%7.0%DEVELOPMENT LAND Low/Acre High/AcreOffice in CBDLand in Office ParksLand in Industrial ParksOffice/Industrial Land - Non-parkRetail/<strong>Commercial</strong> LandResidential$$$$$N/A200,000.00150,000.00150,000.00150,000.0025,000.00$$$$$N/A350,000.00250,000.00250,000.00800,000.00150,000.00Northern New Jersey At A Glance(Rent/SF/YR) Low High Effective Avg. VacancyDOWNTOWN OFFICENew Construction (AAA)Class A (Prime)Class B (Secondary)SUBURBAN OFFICENew Construction (AAA)Class A (Prime)Class B (Secondary)INDUSTRIAL$$$$N/A22.0013.00N/A17.0013.00$$$$N/A40.5027.00N/A50.5025.00N/A$ 28.00$ 25.00N/A$ 28.00$ 22.00N/A12.0%20.0%N/A20.0%16.0%Bulk WarehouseManufacturingHigh Tech/R&DRETAIL$$$2.702.256.50$$$9.506.5016.00$$$6.105.759.3012.0%11.0%11.0%DowntownNeighborhood Service CentersCommunity Power CenterRegional Malls$$$$11.0013.0012.5030.00$$$$45.0027.0026.0060.00$ 26.00$ 19.50$ 20.00$ 50.009.7%7.7%5.1%3.8%DEVELOPMENT LAND Low/Acre High/AcreOffice in CBDLand in Office ParksLand in Industrial ParksOffice/Industrial Land - Non-park$$$N/A250,000.00125,000.00100,000.00$$$N/A600,000.00500,000.00500,000.00Retail/<strong>Commercial</strong> LandResidential$$550,000.00200,000.00$ 2,000,000.00$ 1,000,000.00<strong>2010</strong> <strong>Global</strong> <strong>Market</strong> <strong>Report</strong> ■ www.naiglobal.com 106
- Page 1 and 2:
CommercialCommercial Real Estate Se
- Page 3 and 4:
■ ■ ■ Table of ContentsGENERA
- Page 5 and 6:
Global OutlookCommercial real estat
- Page 7 and 8:
38.3% in November 2009. At the same
- Page 9 and 10:
quality than the Census properties.
- Page 11 and 12:
SaskatchewanSaskatchewan is a small
- Page 13 and 14:
As 2009 draws to a close, there is
- Page 15 and 16:
Global investment interest largely
- Page 18 and 19:
ChinaChina continued to post large
- Page 20 and 21:
MalaysiaWith Malaysia’s dependenc
- Page 22 and 23:
■ US Highlights - Northeast Regio
- Page 24 and 25:
■ US Highlights - Midwest Region
- Page 26 and 27:
■ US Highlights - West Region■
- Page 28 and 29:
Melbourne, AustraliaBeijing, ChinaC
- Page 30 and 31:
Shanghai, ChinaXiamen, ChinaContact
- Page 32 and 33:
Delhi, Gurgaon, IndiaHyderabad, Pra
- Page 34 and 35:
Punjab, IndiaTokyo, JapanContactNAI
- Page 36 and 37:
Seoul, South KoreaTaipei, TaiwanCon
- Page 38 and 39:
Calgary, Alberta, CanadaEdmonton, A
- Page 40 and 41:
Halifax, Nova Scotia, CanadaOttawa,
- Page 42 and 43:
Regina, Saskatchewan, CanadaContact
- Page 44 and 45:
Vienna, AustriaThe Baltics (Latvia/
- Page 46 and 47:
Copenhagen, DenmarkFinlandContactNA
- Page 48 and 49:
Athens, GreeceReykjavik IcelandCont
- Page 50 and 51:
KuwaitOslo, NorwayContactNAI Kuwait
- Page 52 and 53:
Moscow, Russian FederationSt. Peter
- Page 54 and 55:
Madrid, SpainStockholm, SwedenConta
- Page 56 and 57: Istanbul, TurkeyKiev, UkraineContac
- Page 58 and 59: Latin AmericaSECTION CONTENTSBuenos
- Page 60 and 61: Campinas, BrazilCuritiba, BrazilCon
- Page 62 and 63: Sao Paulo, BrazilSantiago, ChileCon
- Page 64 and 65: Ciudad Juarez, Chihuahua, MexicoGua
- Page 66 and 67: Matamoros, Tamaulipas, MexicoMexica
- Page 68 and 69: Reynosa, MexicoSaltillo, Coahuila,
- Page 70 and 71: Torreon, Coahulia, MexicoCaracas, V
- Page 72 and 73: Birmingham, AlabamaHuntsville, Deca
- Page 74 and 75: Jonesboro, ArkansasLittle Rock, Ark
- Page 76 and 77: Marin County, CaliforniaMonterey, C
- Page 78 and 79: Sacramento, CaliforniaSan Diego, Ca
- Page 80 and 81: Santa Clara County (Silicon Valley)
- Page 82 and 83: Colorado Springs, ColoradoDenver, C
- Page 84 and 85: Fort Lauderdale, FloridaFt. Myers/N
- Page 86 and 87: Miami, FloridaOrlando, FloridaConta
- Page 88 and 89: Atlanta, GeorgiaHonolulu, HawaiiCon
- Page 90 and 91: Chicago, IllinoisSpringfield, Illin
- Page 92 and 93: Cedar Rapids, Iowa City, IowaDavenp
- Page 94 and 95: Wichita, KansasLexington, KentuckyC
- Page 96 and 97: Monroe, LouisianaNew Orleans, Louis
- Page 98 and 99: Suburban MarylandBoston, Massachuse
- Page 100 and 101: Grand Rapids, MichiganLansing, Mich
- Page 102 and 103: St. Louis, MissouriBozeman, Montana
- Page 104 and 105: Omaha, NebraskaLas Vegas, NevadaCon
- Page 108 and 109: Ocean/Monmouth Counties (“Shore M
- Page 110 and 111: Las Cruces, New MexicoAlbany, New Y
- Page 112 and 113: Asheville, North CarolinaCharlotte,
- Page 114 and 115: Fargo, North DakotaAkron, OhioConta
- Page 116 and 117: Cleveland, OhioColumbus, OhioContac
- Page 118 and 119: Tulsa, OklahomaPortland, OregonCont
- Page 120 and 121: Bucks County, PennsylvaniaHarrisbur
- Page 122 and 123: Pittsburgh, PennsylvaniaSchuylkill
- Page 124 and 125: Greenville/Spartanburg/Anderson Cou
- Page 126 and 127: Knoxville, TennesseeMemphis, Tennes
- Page 128 and 129: Beaumont, TexasCorpus Christi, Texa
- Page 130 and 131: Fort Worth, TexasHouston, TexasCont
- Page 132 and 133: Texarkana (Bowie County, Texas/Mill
- Page 134 and 135: Northern VirginiaSeattle/Puget Soun
- Page 136 and 137: Madison, WisconsinMilwaukee, Wiscon
- Page 138 and 139: Jackson Hole, WyomingContactNAI Jac
- Page 140: Build on the power of our network.N