Melbourne, AustraliaBeijing, ChinaContact<strong>NAI</strong> Melbourne+61 3 9670 1255Country DataArea (KM 2 )GDP Growth (%)GDP 2009 (US$ B)GDP/Capita (US$)Inflation Rate (%)1334.30.73%$920.01$41,981.701.63%In mid-2009, investors are again showing interest inAustralia’s retail property sector. The market has beeneducated by recent transactions in respect to possible returns,and investors are now actively seeking retail assetsaround the country with the realization that conditions arebecoming increasingly favorable. As signs of improving globaland local economic conditions emerge, private investors andowner occupiers are leading activity levels within Melbourne’sindustrial market.Following a subdued first quarter, sales volumes increasedduring the last three months where more than 70% ofinvestment sales transactions occurred. Investor demandfor quality assets in prime locations with long term leases inplace is expected to continue during the second half of2009. Overall, rents for prime facilities softened by 13%across Melbourne as a result of decreased demand. In aneffort to secure tenants, landlords increased incentivelevels by an average of 3%, now averaging 16% for primebuildings and 18% for secondary properties. Rents andincentive levels are now expected to stabilize acrossMelbourne, with the exception of the South East region,where it is likely landlords will further increase incentivesand soften rents to secure tenants.The Australian economy has slowed significantly and 2009will be remembered as the year when the global economiccrisis had its full impact on the local economy. Currently,access to finance is still a barrier for manyinvestors. However, market conditions have shifted and therisk premiums for investments in commercial property haveincreased notably. Investors in the current market areassessing their property requirements and necessaryinvestment returns. Transactions above US $100 million willbe limited in the near future. However, the level ofactivity is expected to increase considerably in late 2009.It is expected that the retail investment sector will see themajority of transactions occur for neighborhood andsub-regional center types in the price bracket of US $10million - $60 million in the next 12 months.Contact<strong>NAI</strong> Imperial <strong>Real</strong> <strong>Estate</strong>+86 10 5870 0399Country Data*Area (KM 2 )GDP Growth (%)GDP 2009 (US$ B)GDP/Capita (US$)Inflation Rate (%)9,596,9607.7%$3189.12$2,390.11-1.1%Beijing’s economic growth declined slowly in 2009 due tothe global financial crisis. In Q2 2009, Beijing’s GDPincreased by 7.8% year-over-year. Until August 2009, totalfixed asset investment in Beijing increased by 44.3% yearover-year.Investment in real estate development increasedby 44.2% year-over-year. The consumer price index declinedby 1.5%.As the support industry of china’s economy, the real estateindustry is also confronted with severe challenges andthreats. Despite the government’s series of preferentialpolicies, such as lowering interest rates and cutting taxes,most consumers still adopted a wait-and-see attitude,which caused a drop in demand for properties and a declinein prices.The office market was affected by the global financial crisisand greatly increased new supplies. The overall vacancy ratein the Beijing office market maintained an upward tendencyin 2009 and rental rates showed a sharp decline, especiallyin the CBD. Even though rental rates dropped by 15%, theoverall vacancy rate is still trending upward.In addition, because of the economic decline, the retail andindustrial markets are still in a negative state. In the investmentsector, declining property prices and a generallyfavorable outlook for the Chinese market led to a significantvolume of transactions registered in 2009. But the maininvestors have changed from the original foreign buyers todomestic buyers.In the residential market, although sale prices decreased,sales volume did not increase substantially. However, sincethe government’s relaxation of policies in the resale housingmarket, the residential market has now become very active.Because of the relatively large new supply, rental rates andoverall vacancy rates are not expected to return to theprevious strong level. However, with high expectations andconfidence in Beijing from both home and abroad, thedemand for different types of properties should continueto increase.UnemploymentRate (%)6.0%UnemploymentRate (%)4.3%Interest Rate(%)3.5%Interest Rate(%)5.4%Population (Millions) 21.915Melbourne At A GlanceConversion: 1.30 AUD = 1 US$ RENT/M 2 /MO US$ RENT/SF/YEARLow High Low High VacancyDOWNTOWN OFFICENew Construction (AAA)Class A (Prime)Class B (Secondary)SUBURBAN OFFICENew Construction (AAA)Class A (Prime)Class B (Secondary)INDUSTRIALBulk WarehouseManufacturingHigh Tech/R&DRETAILDowntownNeighborhood Service CentersCommunity Power CenterRegional MallsSolus Food StoresDEVELOPMENT LANDOffice in CBDLand in Office ParksLand in Industrial ParksOffice/Industrial Land - Non-parkRetail/<strong>Commercial</strong> LandResidentialAUD 450.00 AUD 500.00 $ 39.07 $ 43.41 4.0%AUD 400.00 AUD 450.00 $ 34.73 $ 39.07 5.0%AUD 300.00 AUD 350.00 $ 26.05 $ 30.39 6.0%AUD 250.00 AUD 270.00 $ 21.71 $ 23.44 5.0%AUD 220.00 AUD 230.00 $ 19.10 $ 19.97 5.0%AUD 180.00 AUD 190.00 $ 15.63 $ 16.50 7.0%AUD 130.00 AUD 40.00 $ 11.29 $ 12.16 6.0%AUD 130.00 AUD 140.00 $ 11.29 $ 12.16 9.0%AUD 150.00 AUD 160.00 $ 13.02 $ 13.89 5.0%AUD 800.00 AUD 900.00 $ 69.46 $ 78.14 3.0%AUD 450.00 AUD 500.00 $ 39.07 $ 43.41 6.0%N/A N/A N/A N/A N/AAUD 1,700.00 AUD 2,000.00 $147.60 $173.65 2.0%N/A N/A N/A N/A N/ALow/M 2 High/M 2 Low/SF High/SFN/A N/A N/A N/AAUD 150.00 AUD 160.00 $ 140.19 $ 149.53AUD 110.00 AUD 120.00 $ 102.80 $ 112.15AUD 120.00 AUD 130.00 $ 112.15 $ 121.50AUD 850.00 AUD 900.00 $ 794.39 $ 841.12AUD 1,400.00 AUD 1,500.00 $1,308.41 $1,401.87Population (Millions) 1334.3*National Bureau of Statistics of Chinain 3Q2009Beijing At A GlanceConversion: 6.83 RMB = 1 US$ RENT/M 2 /MO US$ RENT/SF/YRLow High Low High VacancyDOWNTOWN OFFICENew Construction (AAA)Class A (Prime)RMB 2,160.00 RMB 2,520.00RMB 1,740.00 RMB 4,320.00$ 29.38$ 23.67$$34.2858.7660.0%10.0%Class B (Secondary)SUBURBAN OFFICERMB 794.00 RMB 1,440.00 $ 10.80 $ 19.59 15.0%New Construction (AAA)Class A (Prime)RMB 2,400.00 RMB 3,300.00RMB 1,680.00 RMB 3,600.00$ 32.65$ 22.85$$44.8948.9740.0%10.0%Class B (Secondary)INDUSTRIALRMB 840.00 RMB 1,560.00 $ 11.43 $ 21.22 13.0%Bulk WarehouseManufacturingRMBRMB216.00 RMB216.00 RMB540.00468.00$$2.942.94$$7.356.37N/AN/AHigh Tech/R&DRETAILRMB 648.00 RMB 1,008.00 $ 8.81 $ 13.71 N/ADowntownRMB 3,000.00 RMB 14,880.00 $ 40.81 $ 202.40 13.0%Neighborhood Service CentersCommunity Power CenterRMBRMB420.00 RMB 1,620.00300.00 RMB 1,920.00$$5.714.08$$22.0426.1225.0%17.0%Regional MallsN/A N/A N/A N/A N/ASolus Food StoresRMB 1,080.00 RMB 7,560.00 $ 14.69 $ 102.83 9.0%DEVELOPMENT LAND Low/M 2 High/M 2 Low/Acre High/AcreOffice in CBDLand in Office ParksLand in Industrial ParksOffice/Industrial Land - Non-parkRetail/<strong>Commercial</strong> LandResidentialRMB 5,990.00 RMB 12,905.00 $ 81.48 $ 175.53RMB 3,745.00 RMB 9,975.00 $ 50.94 $ 135.68RMB 395.00 RMB 4,594.00 $ 5.37 $ 62.49RMB 8,840.00 RMB 14,840.00 $ 120.24 $ 201.85RMB 4,407.00 RMB 15,270.00 $ 59.94 $ 207.70RMB 1,079.00 RMB 14,920.00 $ 14.68 $ 202.94<strong>2010</strong> <strong>Global</strong> <strong>Market</strong> <strong>Report</strong> ■ www.naiglobal.com 27
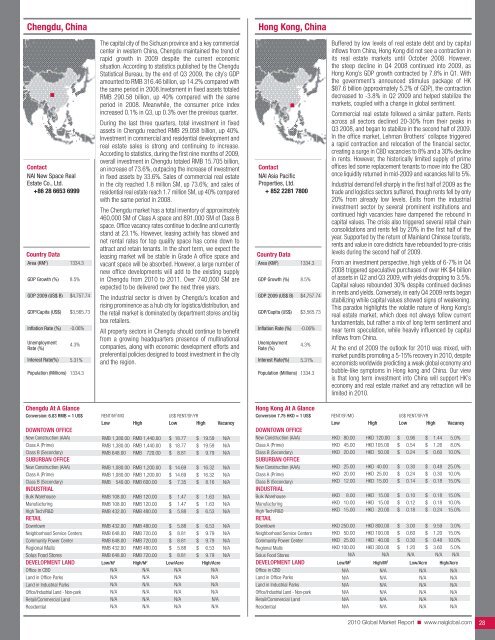
Chengdu, ChinaHong Kong, ChinaContact<strong>NAI</strong> New Space <strong>Real</strong><strong>Estate</strong> Co., Ltd.+86 28 6653 6999Country DataArea (KM 2 )GDP Growth (%)GDP 2009 (US$ B)GDP/Capita (US$)Inflation Rate (%)UnemploymentRate (%)Interest Rate(%)1334.38.5%$4,757.74$3,565.73-0.06%4.3%5.31%Population (Millions) 1334.3The capital city of the Sichuan province and a key commercialcenter in western China, Chengdu maintained the trend ofrapid growth in 2009 despite the current economicsituation. According to statistics published by the ChengduStatistical Bureau, by the end of Q3 2009, the city’s GDPamounted to RMB 316.46 billion, up 14.2% compared withthe same period in 2008.Invetsment in fixed assets totaledRMB 290.58 billion, up 40% compared with the sameperiod in 2008. Meanwhile, the consumer price indexincreased 0.1% in Q3, up 0.3% over the previous quarter.During the last three quarters, total investment in fixedassets in Chengdu reached RMB 29.058 billion, up 40%.Investment in commercial and residential development andreal estate sales is strong and continuing to increase.According to statistics, during the first nine months of 2009,overall investment in Chengdu totaled RMB 15.705 billion,an increase of 73.6%, outpacing the increase of investmentin fixed assets by 33.6%. Sales of commercial real estatein the city reached 1.8 million SM, up 73.6%; and sales ofresidential real estate reach 1.7 million SM, up 40% comparedwith the same period in 2008.The Chengdu market has a total inventory of approximately460,000 SM of Class A space and 891,000 SM of Class Bspace. Office vacancy rates continue to decline and currentlystand at 23.1%. However, leasing activity has slowed andnet rental rates for top quality space has come down toattract and retain tenants. In the short term, we expect theleasing market will be stable in Grade A office space andvacant space will be absorbed. However, a large number ofnew office developments will add to the existing supplyin Chengdu from <strong>2010</strong> to 2011. Over 740,000 SM areexpected to be delivered over the next three years.The industrial sector is driven by Chengdu’s location andrising prominence as a hub city for logistics/distribution, andthe retail market is dominated by department stores and bigbox retailers.All property sectors in Chengdu should continue to benefitfrom a growing headquarters presence of multinationalcompanies, along with economic development efforts andpreferential policies designed to boost investment in the cityand the region.Contact<strong>NAI</strong> Asia PacificProperties, Ltd.+ 852 2281 7800Country DataArea (KM 2 )GDP Growth (%)GDP 2009 (US$ B)GDP/Capita (US$)Inflation Rate (%)UnemploymentRate (%)Interest Rate(%)1334.38.5%$4,757.74$3,565.73-0.06%4.3%5.31%Population (Millions) 1334.3Buffered by low levels of real estate debt and by capitalinflows from China, Hong Kong did not see a contraction inits real estate markets until October 2008. However,the steep decline in Q4 2008 continued into 2009, asHong Kong’s GDP growth contracted by 7.8% in Q1. Withthe government’s announced stimulus package of HK$87.6 billion (approximately 5.2% of GDP), the contractiondecreased to -3.8% in Q2 2009 and helped stabilize themarkets, coupled with a change in global sentiment.<strong>Commercial</strong> real estate followed a similar pattern. Rentsacross all sectors declined 20-30% from their peaks inQ3 2008, and began to stabilize in the second half of 2009.In the office market, Lehman Brothers’ collapse triggereda rapid contraction and relocation of the financial sector,creating a surge in CBD vacancies to 8% and a 30% declinein rents. However, the historically limited supply of primeoffices led some replacement tenants to move into the CBDonce liquidity returned in mid-2009 and vacancies fell to 5%.Industrial demand fell sharply in the first half of 2009 as thetrade and logistics sectors suffered, though rents fell by only20% from already low levels. Exits from the industrialinvestment sector by several prominent institutions andcontinued high vacancies have dampened the rebound incapital values. The crisis also triggered several retail chainconsolidations and rents fell by 20% in the first half of theyear. Supported by the return of Mainland Chinese tourists,rents and value in core districts have rebounded to pre-crisislevels during the second half of 2009.From an investment perspective, high yields of 6-7% in Q42008 triggered speculative purchases of over HK $4 billionof assets in Q2 and Q3 2009, with yields dropping to 3.5%.Capital values rebounded 30% despite continued declinesin rents and yields. Conversely, in early Q4 2009 rents beganstabilizing while capital values showed signs of weakening.This paradox highlights the volatile nature of Hong Kong’sreal estate market, which does not always follow currentfundamentals, but rather a mix of long term sentiment andnear term speculation, while heavily influenced by capitalinflows from China.At the end of 2009 the outlook for <strong>2010</strong> was mixed, withmarket pundits promoting a 5-15% recovery in <strong>2010</strong>, despiteeconomists worldwide predicting a weak global economy andbubble-like symptoms in Hong kong and China. Our viewis that long term investment into China will support HK’seconomy and real estate market and any retraction will belimited in <strong>2010</strong>.Chengdu At A GlanceConversion: 6.83 RMB = 1 US$ RENT/M 2 /MO US$ RENT/SF/YRLow High Low High VacancyDOWNTOWN OFFICENew Construction (AAA)Class A (Prime)RMB 1,380.00 RMB 1,440.00RMB 1,380.00 RMB 1,440.00$ 18.77$ 18.77$$19.5919.59N/AN/AClass B (Secondary)SUBURBAN OFFICERMB 648.00 RMB 720.00 $ 8.81 $ 9.79 N/ANew Construction (AAA)Class A (Prime)RMB 1,080.00 RMB 1,200.00RMB 1,080.00 RMB 1,200.00$ 14.69$ 14.69$$16.3216.32N/AN/AClass B (Secondary)INDUSTRIALRMB 540.00 RMB 600.00 $ 7.35 $ 8.16 N/ABulk WarehouseManufacturingHigh Tech/R&DRETAILDowntownNeighborhood Service CentersCommunity Power CenterRegional MallsSolus Food StoresRMB 108.00RMB 108.00RMB 432.00RMB 432.00RMB 648.00RMB 648.00RMB 432.00RMB 648.00RMB 120.00RMB 120.00RMB 480.00RMB 480.00RMB 720.00RMB 720.00RMB 480.00RMB 720.00$$$$$$$$1.471.475.885.888.818.815.888.81$$$$$$$$1.631.636.536.539.799.796.539.79N/AN/AN/AN/AN/AN/AN/AN/ADEVELOPMENT LAND Low/M 2 High/M 2 Low/Acre High/AcreOffice in CBDLand in Office ParksLand in Industrial ParksOffice/Industrial Land - Non-parkRetail/<strong>Commercial</strong> LandResidentialN/A N/A N/A N/AN/A N/A N/A N/AN/A N/A N/A N/AN/A N/A N/A N/AN/A N/A N/A N/AN/A N/A N/A N/AHong Kong At A GlanceConversion 7.75 HKD = 1 US$ RENT/SF/MO US$ RENT/SF/YRLow High Low High VacancyDOWNTOWN OFFICENew Construction (AAA)Class A (Prime)Class B (Secondary)SUBURBAN OFFICENew Construction (AAA)Class A (Prime)Class B (Secondary)INDUSTRIALHKD 80.00HKD 45.00HKD 20.00HKD 25.00HKD 20.00HKD 12.00HKD 120.00HKD 105.00HKD 50.00HKD 40.00HKD 25.00HKD 15.00$$$$$$0.960.540.240.300.240.14$$$$$$1.441.260.600.480.300.185.0%8.0%10.0%25.0%10.0%15.0%Bulk WarehouseHKD 8.00 HKD 15.00 $ 0.10 $ 0.18 15.0%ManufacturingHigh Tech/R&DRETAILDowntownNeighborhood Service CentersCommunity Power CenterRegional MallsSolus Food StoresHKD 10.00HKD 15.00HKD 250.00HKD 50.00HKD 25.00HKD 100.00N/AHKD 15.00HKD 20.00HKD 800.00HKD 100.00HKD 40.00HKD 300.00N/A$$$$$$0.120.183.000.600.301.20N/A$$$$$$0.180.249.591.200.483.60N/A10.0%15.0%3.0%15.0%10.0%5.0%N/ADEVELOPMENT LAND Low/M 2 High/M 2 Low/Acre High/AcreOffice in CBDLand in Office ParksLand in Industrial ParksOffice/Industrial Land - Non-parkRetail/<strong>Commercial</strong> LandResidentialN/A N/A N/A N/AN/A N/A N/A N/AN/A N/A N/A N/AN/A N/A N/A N/AN/A N/A N/A N/AN/A N/A N/A N/A<strong>2010</strong> <strong>Global</strong> <strong>Market</strong> <strong>Report</strong> ■ www.naiglobal.com 28
- Page 1 and 2: CommercialCommercial Real Estate Se
- Page 3 and 4: ■ ■ ■ Table of ContentsGENERA
- Page 5 and 6: Global OutlookCommercial real estat
- Page 7 and 8: 38.3% in November 2009. At the same
- Page 9 and 10: quality than the Census properties.
- Page 11 and 12: SaskatchewanSaskatchewan is a small
- Page 13 and 14: As 2009 draws to a close, there is
- Page 15 and 16: Global investment interest largely
- Page 18 and 19: ChinaChina continued to post large
- Page 20 and 21: MalaysiaWith Malaysia’s dependenc
- Page 22 and 23: ■ US Highlights - Northeast Regio
- Page 24 and 25: ■ US Highlights - Midwest Region
- Page 26 and 27: ■ US Highlights - West Region■
- Page 30 and 31: Shanghai, ChinaXiamen, ChinaContact
- Page 32 and 33: Delhi, Gurgaon, IndiaHyderabad, Pra
- Page 34 and 35: Punjab, IndiaTokyo, JapanContactNAI
- Page 36 and 37: Seoul, South KoreaTaipei, TaiwanCon
- Page 38 and 39: Calgary, Alberta, CanadaEdmonton, A
- Page 40 and 41: Halifax, Nova Scotia, CanadaOttawa,
- Page 42 and 43: Regina, Saskatchewan, CanadaContact
- Page 44 and 45: Vienna, AustriaThe Baltics (Latvia/
- Page 46 and 47: Copenhagen, DenmarkFinlandContactNA
- Page 48 and 49: Athens, GreeceReykjavik IcelandCont
- Page 50 and 51: KuwaitOslo, NorwayContactNAI Kuwait
- Page 52 and 53: Moscow, Russian FederationSt. Peter
- Page 54 and 55: Madrid, SpainStockholm, SwedenConta
- Page 56 and 57: Istanbul, TurkeyKiev, UkraineContac
- Page 58 and 59: Latin AmericaSECTION CONTENTSBuenos
- Page 60 and 61: Campinas, BrazilCuritiba, BrazilCon
- Page 62 and 63: Sao Paulo, BrazilSantiago, ChileCon
- Page 64 and 65: Ciudad Juarez, Chihuahua, MexicoGua
- Page 66 and 67: Matamoros, Tamaulipas, MexicoMexica
- Page 68 and 69: Reynosa, MexicoSaltillo, Coahuila,
- Page 70 and 71: Torreon, Coahulia, MexicoCaracas, V
- Page 72 and 73: Birmingham, AlabamaHuntsville, Deca
- Page 74 and 75: Jonesboro, ArkansasLittle Rock, Ark
- Page 76 and 77: Marin County, CaliforniaMonterey, C
- Page 78 and 79:
Sacramento, CaliforniaSan Diego, Ca
- Page 80 and 81:
Santa Clara County (Silicon Valley)
- Page 82 and 83:
Colorado Springs, ColoradoDenver, C
- Page 84 and 85:
Fort Lauderdale, FloridaFt. Myers/N
- Page 86 and 87:
Miami, FloridaOrlando, FloridaConta
- Page 88 and 89:
Atlanta, GeorgiaHonolulu, HawaiiCon
- Page 90 and 91:
Chicago, IllinoisSpringfield, Illin
- Page 92 and 93:
Cedar Rapids, Iowa City, IowaDavenp
- Page 94 and 95:
Wichita, KansasLexington, KentuckyC
- Page 96 and 97:
Monroe, LouisianaNew Orleans, Louis
- Page 98 and 99:
Suburban MarylandBoston, Massachuse
- Page 100 and 101:
Grand Rapids, MichiganLansing, Mich
- Page 102 and 103:
St. Louis, MissouriBozeman, Montana
- Page 104 and 105:
Omaha, NebraskaLas Vegas, NevadaCon
- Page 106 and 107:
Portsmouth, New HampshireAtlantic C
- Page 108 and 109:
Ocean/Monmouth Counties (“Shore M
- Page 110 and 111:
Las Cruces, New MexicoAlbany, New Y
- Page 112 and 113:
Asheville, North CarolinaCharlotte,
- Page 114 and 115:
Fargo, North DakotaAkron, OhioConta
- Page 116 and 117:
Cleveland, OhioColumbus, OhioContac
- Page 118 and 119:
Tulsa, OklahomaPortland, OregonCont
- Page 120 and 121:
Bucks County, PennsylvaniaHarrisbur
- Page 122 and 123:
Pittsburgh, PennsylvaniaSchuylkill
- Page 124 and 125:
Greenville/Spartanburg/Anderson Cou
- Page 126 and 127:
Knoxville, TennesseeMemphis, Tennes
- Page 128 and 129:
Beaumont, TexasCorpus Christi, Texa
- Page 130 and 131:
Fort Worth, TexasHouston, TexasCont
- Page 132 and 133:
Texarkana (Bowie County, Texas/Mill
- Page 134 and 135:
Northern VirginiaSeattle/Puget Soun
- Page 136 and 137:
Madison, WisconsinMilwaukee, Wiscon
- Page 138 and 139:
Jackson Hole, WyomingContactNAI Jac
- Page 140:
Build on the power of our network.N