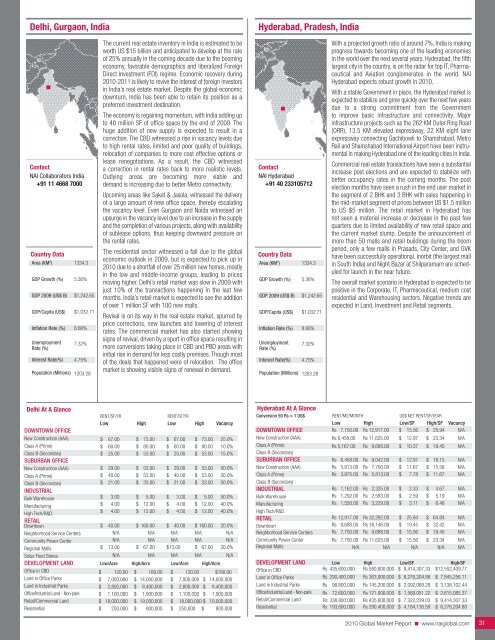
Delhi, Gurgaon, IndiaHyderabad, Pradesh, IndiaContact<strong>NAI</strong> Collaborators India+91 11 4668 7000Country DataArea (KM 2 )GDP Growth (%)GDP 2009 (US$ B)GDP/Capita (US$)Inflation Rate (%)UnemploymentRate (%)Interest Rate(%)1334.35.36%$1,242.65$1,032.718.66%7.32%4.75%Population (Millions) 1203.28The current real estate inventory in India is estimated to beworth US $15 billion and anticipated to develop at the rateof 25% annually in the coming decade due to the boomingeconomy, favorable demographics and liberalized ForeignDirect Investment (FDI) regime. Economic recovery during<strong>2010</strong>-2011 is likely to revive the interest of foreign investorsin India’s real estate market. Despite the global economicdownturn, India has been able to retain its position as apreferred investment destination.The economy is regaining momentum, with India adding upto 40 million SF of office space by the end of 2009. Thehuge addition of new supply is expected to result in acorrection. The CBD witnessed a rise in vacancy levels dueto high rental rates, limited and poor quality of buildings,relocation of companies to more cost effective options orlease renegotiations. As a result, the CBD witnesseda correction in rental rates back to more realistic levels.Outlying areas are becoming more viable anddemand is increasing due to better Metro connectivity.Upcoming areas like Saket & Jasola, witnessed the deliveryof a large amount of new office space, thereby escalatingthe vacancy level. Even Gurgaon and Noida witnessed anupsurge in the vacancy level due to an increase in the supplyand the completion of various projects, along with availabilityof sublease options, thus keeping downward pressure onthe rental rates.The residential sector witnessed a fall due to the globaleconomic outlook in 2009, but is expected to pick up in<strong>2010</strong> due to a shortfall of over 25 million new homes, mostlyin the low and middle-income groups, leading to pricesmoving higher. Delhi’s retail market was slow in 2009 withjust 10% of the transactions happening in the last fewmonths. India’s retail market is expected to see the additionof over 1 million SF with 100 new malls.Revival is on its way in the real estate market, spurred byprice corrections, new launches and lowering of interestrates. The commercial market has also started showingsigns of revival, driven by a spurt in office space resulting inmore conversions taking place in CBD and PBD areas withinitial rise in demand for less costly premises. Though mostof the deals that happened were of relocation. The officemarket is showing visible signs of renewal in demand.Contact<strong>NAI</strong> Hyderabad+91 40 233105712Country DataArea (KM 2 )GDP Growth (%)GDP 2009 (US$ B)GDP/Capita (US$)Inflation Rate (%)UnemploymentRate (%)Interest Rate(%)1334.35.36%$1,242.65$1,032.718.66%7.32%4.75%Population (Millions) 1203.28With a projected growth ratio of around 7%, India is makingprogress towards becoming one of the leading economiesin the world over the next several years. Hyderabad, the fifthlargest city in the country, is on the radar for top IT, Pharmaceuticaland Aviation conglomerates in the world. <strong>NAI</strong>Hyderabad expects robust growth in <strong>2010</strong>.With a stable Government in place, the Hyderabad market isexpected to stabilize and grow quickly over the next few yearsdue to a strong commitment from the Governmentto improve basic infrastructure and connectivity. Majorinfrastructure projects such as the 262 KM Outer Ring Road(ORR), 13.5 KM elevated expressway, 22 KM eight laneexpressway connecting Gachibowli to Shamshabad, MetroRail and Shamshabad International Airport have been instrumentalin making Hyderabad one of the leading cities in India.<strong>Commercial</strong> real estate transactions have seen a substantialincrease post elections and are expected to stabilize withbetter occupancy rates in the coming months. The postelection months have seen a rush in the end user market inthe segment of 2 BHK and 3 BHK with sales happening inthe mid-market segment of prices between US $1.5 millionto US $5 million. The retail market in Hyderabad hasnot seen a material increase or decrease in the past fewquarters due to limited availability of new retail space andthe current market slump. Despite the announcement ofmore than 50 malls and retail buildings during the boomperiod, only a few malls in Prasads, City Center, and GVKhave been successfully operational. Inorbit (the largest mallin South India) and Night Bazar at Shilparamam are scheduledfor launch in the near future.The overall market scenario in Hyderabad is expected to bepositive in the Corporate, IT, Pharmaceutical, medium costresidential and Warehousing sectors. Negative trends areexpected in Land, Investment and Retail segments.Delhi At A GlanceRENT/SF/YRRENT/SF/YRLow High Low High VacancyDOWNTOWN OFFICENew Construction (AAA)Class A (Prime)Class B (Secondary)SUBURBAN OFFICENew Construction (AAA)Class A (Prime)Class B (Secondary)INDUSTRIALBulk WarehouseManufacturingHigh Tech/R&DRETAIL$$$$$$$$$67.0060.0025.0029.0040.0021.003.004.004.00$$$$$$$$$73.0080.0053.0053.0053.0033.005.0012.0012.00$$$$$$$$$67.0060.0025.0029.0040.0021.003.004.004.00$$$$$$$$$73.0080.0053.0053.0053.0033.005.0012.0012.0025.0%10.0%15.0%50.0%20.0%50.0%50.0%40.0%40.0%DowntownNeighborhood Service CentersCommunity Power Center$ 40.00N/AN/A$ 160.00N/AN/A$ 40.00N/AN/A$ 160.00N/AN/A20.0%N/AN/ARegional Malls$ 13.00 $ 67.00 $13.00 $ 67.00 20.0%Solus Food StoresN/A N/A N/A N/A N/ADEVELOPMENT LAND Low/Acre High/Acre Low/Acre High/AcreOffice in CBDLand in Office ParksLand in Industrial ParksOffice/Industrial Land - Non-parkRetail/<strong>Commercial</strong> LandResidential$ 120.00 $ 180.00 $ 120.00 $180.00$ 7,000,000 $ 14,000,000 $ 7,000,000 $ 14,000,000$ 2,800,000 $ 8,400,000 $ 2,800,000 $ 8,400,000$ 1,100,000 $ 1,900,000 $ 1,100,000 $ 1,900,000$ 18,000,000 $ 19,000,000 $ 18,000,000 $ 19,000,000$ 250,000 $ 800,000 $ 250,000 $ 800,000Hyderabad At A GlanceConversion 50 Rs = 1 US$ RENT/M2/MONTH US$ NET RENT/SF/YEARLow High Low/SF High/SF VacancyDOWNTOWN OFFICERs 7,750.00 Rs 12,917.00 $ 15.56 $ 25.94 N/ANew Construction (AAA)Class A (Prime)Class B (Secondary)SUBURBAN OFFICENew Construction (AAA)Class A (Prime)Class B (Secondary)INDUSTRIALRs 6,458.00Rs 5,167.00Rs 6,458.00Rs 5,813.00Rs 3,875.00Rs 1,162.00Rs 11,625.00Rs 9,688.00Rs 9,042.00Rs 7,750.00Rs 5,813.00Rs 2,325.00$$$$$$12.9710.3712.9711.677.782.33$$$$$$23.3419.4518.1515.5611.674.67N/AN/AN/AN/AN/AN/ABulk WarehouseManufacturingHigh Tech/R&DRs 1,292.00Rs 1,550.00RsRs2,583.003,229.00$$2.593.11$$5.196.48N/AN/ARETAILDowntownRs 12,917.00Rs 9,688.00Rs 32,292.00Rs 16,146.00$$25.9419.45$$64.8432.42N/AN/ANeighborhood Service Centers Rs 7,750.00 Rs 9,688.00 $ 15.56 $ 19.45 N/ACommunity Power CenterRegional MallsRs 7,750.00N/ARs 11,625.00N/A$ 15.56N/A$ 23.34N/AN/AN/ADEVELOPMENT LAND Low High Low/SF High/SFOffice in CBDLand in Office ParksRs 435,600,000Rs 290,400,000Rs 580,800,000Rs 363,000,000$ 9,414,307.33$ 6,276,204.88$12,552,409.77$ 7,845,256.11Land in Industrial Parks Rs 96,800,000 Rs 145,200,000 $ 2,092,068.29 $ 3,138,102.44Office/Industrial Land - Non-park Rs 72,600,000 Rs 121,000,000 $ 1,569,051.22 $ 2,615,085.37Retail/<strong>Commercial</strong> Land Rs 338,800,000 Rs 435,600,000 $ 7,322,239.03 $ 9,414,307.33ResidentialRs 193,600,000 Rs 290,400,000 $ 4,184,136.59 $ 6,276,204.88<strong>2010</strong> <strong>Global</strong> <strong>Market</strong> <strong>Report</strong> ■ www.naiglobal.com31
Kolkata, IndiaPune, Maharashtra, IndiaContact<strong>NAI</strong> NK <strong>Real</strong>tors Pvt. Ltd.+91 33 24868016/7017/7519Country DataArea (KM 2 )GDP Growth (%)GDP 2009 (US$ B)GDP/Capita (US$)Inflation Rate (%)1334.35.36%$1,242.65$1,032.718.66%With a population of more than 15 million people, Kolkata isthe world’s 8th largest and India’s third largest metropolitancity. It is the capital of the Indian state of West Bengal anda main center for commerce and financial services in easternIndia and northeastern states. The city is home to manyregional and corporate headquarters.The total office inventory in Kolkata is in excess of 26 millionSF. About 85% of the inventory is in the suburban areassuch as Topsia, Kasba, Sector-V and Rajarhat, includingIT parks and IT SEZ’s. Downtown Class A office propertyrental rates have fallen from INR 150-160/SF per month inSeptember 2008 to INR 90-100/SF per month in September2009. Vacancy in Class A space in the CBD was at 4%,while Sector-V experienced 50% vacancy overall with rentalrates of INR 40-45/SF per month. A significant portion ofthe current office demand came from the telecom sectordue to the telecom boom and recorded over 365,000 SF intransactions since January 2009.The retail sector in Kolkata suffered the most over the last12 months due to plunging sales and high occupancy costs.Rental values started falling in October 2008. Rental ratesin downtown mall space declined around 40% and averagerentals in suburban malls fell around 17%.Kolkata’s residential market has experienced a moderaterecovery since March 2009 due to the growing demand foraffordable housing. A number of such housing projects likeParvati Garden in Birati, Sugam Sabuj in Narendrapur andGreen Field City near Behala Chowrasta are coming up inthe Kolkata market.Kolkata had been successful in pulling significant industrialinvestments over the last couple of years. But the exitof TATA Motors small car project impacted the overallinvestment climate. In May 2009, the government’s proactivemeasures towards industrialization have brought Bengalback into focus of global investors.Contact<strong>NAI</strong> Property Terminus+91 20 25511900Country DataArea (KM 2 )GDP Growth (%)GDP 2009 (US$ B)GDP/Capita (US$)Inflation Rate (%)1334.37.90%$1,242.65$1,032.718.66%Pune is strategically located 150 kilometers from Mumbai,the financial capital of India. The key drivers of this city stemfrom the turbine industries like Alfa-Laval, Thermax, etc.Bharat Forge is the world's second largest forging company.Pune also is home to large IT companies like HSBC andInfosys. The auto industry and telecommunications sectorsare on an upward trend, while IT remains reticent.Pune has not escaped the effects of the global slowdown,with rentals decreasing in the range of 10-40% .Vacancyrates reached a new high, the retail market crashed and thegloom of uncertainty spread fast even through the residentialsector.In Q3, Pune began to bounce back after a positive changein the economy. The markets were definitely abuzz withhectic shopping heralded by massive sales in gold. Lack ofconfidence in the market was replaced by vibrant buoyancyand a spirit of cheer and celebration prevails. Genuineinvestors are taking advantage of the market correction andbuilders are threatening to hike rates. Finally, the muchawaited stability is having an impact.Some of the larger deals recorded in Pune were SynechronTechnologies Pvt. Ltd in. Embassy for 75,000 SF, SEZ atHinjewadi TietoEnator at EON SEZ in Kharadi at 60,000 SF,Aegis BPO at Commerzone in Yerwada with 50,000 SF, BNYMellon at Magarpatta Cybercity in Hadapsar at 125,000 SF,and Sungard at EON SEZ in Kharadi with 60,000 SF.Construction that had been put on hold is now opening upwith new developments like ZerO 1ne at Ghorpadi; PrabhaveeTech Park, Nano Space, Amar Synergy Connaught Road, andAmar Paradigm at Baner; and several more. Pune’s futureappears to be bright in all commercial property sectors.Pune is known as the Oxford of the east, boasting someof the finest educational institutions, namely the highlyregarded Pune University. Pune is the seventh largest metrocity in India and has the highest per capita income inthe country.UnemploymentRate (%)7.32%UnemploymentRate (%)7.32%Interest Rate(%)4.75%Interest Rate(%)4.75%Population (Millions)1203.28Population (Millions) 1203.28Kolkata At A GlanceConversion: 46 INR = 1 US$ NET RENT/SF/MO US$ RENT/SF/YRLow High Low High VacancyDOWNTOWN OFFICENew Construction (AAA)Class A (Prime)Class B (Secondary)SUBURBAN OFFICENew Construction (AAA)Class A (Prime)Class B (Secondary)INDUSTRIALBulk WarehouseManufacturingHigh Tech/R&DRETAILDowntownNeighborhood Service CentersCommunity Power CenterRegional MallsINR 128.00INR 100.00INR 67.00INR 50.00INR 45.00INR 39.00INR 12.00N/AN/AINR 91.00INR 95.00INR 95.00INR 123.00INR 156.00INR 111.00INR 100.00INR 61.00INR 50.00INR 45.00INR 20.00N/AN/AINR 245.00INR 145.00INR 162.00INR 251.00$$$$$$$$$$$33.3926.0917.4813.0411.7410.173.13N/AN/A23.7423.7424.7832.09$$$$$$$$$$$40.7028.9626.0915.9113.0411.745.22N/AN/A63.9163.9142.2665.4825.0%4.0%5.0%70.0%60.0%40.0%25.0%N/AN/A15.0%14.0%71.0%2.0%Solus Food StoresDEVELOPMENT LANDINR 33.00Low/AcreINR 39.00High/Acre$ 8.61Low/SF$10.17 N/AHigh/SFOffice in CBDLand in Office ParksLand in Industrial ParksOffice/Industrial Land - Non-parkRetail/<strong>Commercial</strong> LandResidentialINR 420,000,000 INR 600,000,000 $ 209.61 $ 299.44INR 150,000,000 INR 200,000,000 $ 74.86 $ 99.81INR 15,000,000 INR 20,000,000 $ 7.49 $ 9.98INR 12,000,000 INR 30,000,000 $ 5.99 $ 14.97INR 400,000,000 INR 600,000,000 $ 199.62 $ 299.44INR 12,000,000 INR 600,000,000 $ 5.99 $ 299.44Pune At A GlanceConversion: 45 INR = 1 US$ RENT/SF/MO US$ RENT/SF/YRLow High Low High VacancyCITY CENTER OFFICENew Construction (AAA)Class A (Prime)INR 45.00INR 50.00INR 75.00INR 60.00$ 12.00$ 13.33$$20.0016.0080.0%40.0%Class B (Secondary)SUBURBAN OFFICENew Construction (AAA)INR 35.00INR 30.00INR 45.00INR 50.00$$9.338.00$$12.0013.3350.0%55.0%Class A (Prime)INR 50.00 INR 60.00 $ 13.33 $ 16.00 60.0%Class B (Secondary)INDUSTRIALBulk WarehouseManufacturingHigh Tech/R&DRETAILINR 35.00INR 12.00INR 18.00INR 18.00INR 45.00INR 26.00INR 45.00INR 45.00$$$$9.333.204.804.80$$$$12.006.9312.0012.0072.0%5.0%0.5%N/ADowntownNeighborhood Service CentersCommunity Power CenterRegional MallsSolus Food StoresINR 70.00INR 70.00INR 70.00INR 60.00INR 100.00INR 150.00INR 120.00INR 120.00INR 100.00INR 125.00$ 18.67$ 18.67$ 18.67$ 16.00$ 26.67$$$$$40.0032.0032.0026.6733.3315.0%20.0%25.0%35.0%20.0%DEVELOPMENT LAND Low/Acre High/Acre Low/Acre High/AcreOffice in CBDLand in Office ParksLand in Industrial ParksOffice/Industrial Land - Non-parkRetail/<strong>Commercial</strong> LandResidentialINR 6,000.00 INR 8,000.00 $ 133.00 $ 177.00INR 700.00 INR 5,000.00 $ 15.00 $ 111.00INR 50.00 INR 500.00 $ 1.00 $ 11.00INR 3,000.00 INR 10,000.00 $ 67.00 $ 222.00INR 1,200.00 INR 10,000.00 $ 27.00 $ 222.00INR 2,500.00 INR 8,500.00 $ 55.00 $ 189.00<strong>2010</strong> <strong>Global</strong> <strong>Market</strong> <strong>Report</strong> ■ www.naiglobal.com 32
- Page 1 and 2: CommercialCommercial Real Estate Se
- Page 3 and 4: ■ ■ ■ Table of ContentsGENERA
- Page 5 and 6: Global OutlookCommercial real estat
- Page 7 and 8: 38.3% in November 2009. At the same
- Page 9 and 10: quality than the Census properties.
- Page 11 and 12: SaskatchewanSaskatchewan is a small
- Page 13 and 14: As 2009 draws to a close, there is
- Page 15 and 16: Global investment interest largely
- Page 18 and 19: ChinaChina continued to post large
- Page 20 and 21: MalaysiaWith Malaysia’s dependenc
- Page 22 and 23: ■ US Highlights - Northeast Regio
- Page 24 and 25: ■ US Highlights - Midwest Region
- Page 26 and 27: ■ US Highlights - West Region■
- Page 28 and 29: Melbourne, AustraliaBeijing, ChinaC
- Page 30 and 31: Shanghai, ChinaXiamen, ChinaContact
- Page 34 and 35: Punjab, IndiaTokyo, JapanContactNAI
- Page 36 and 37: Seoul, South KoreaTaipei, TaiwanCon
- Page 38 and 39: Calgary, Alberta, CanadaEdmonton, A
- Page 40 and 41: Halifax, Nova Scotia, CanadaOttawa,
- Page 42 and 43: Regina, Saskatchewan, CanadaContact
- Page 44 and 45: Vienna, AustriaThe Baltics (Latvia/
- Page 46 and 47: Copenhagen, DenmarkFinlandContactNA
- Page 48 and 49: Athens, GreeceReykjavik IcelandCont
- Page 50 and 51: KuwaitOslo, NorwayContactNAI Kuwait
- Page 52 and 53: Moscow, Russian FederationSt. Peter
- Page 54 and 55: Madrid, SpainStockholm, SwedenConta
- Page 56 and 57: Istanbul, TurkeyKiev, UkraineContac
- Page 58 and 59: Latin AmericaSECTION CONTENTSBuenos
- Page 60 and 61: Campinas, BrazilCuritiba, BrazilCon
- Page 62 and 63: Sao Paulo, BrazilSantiago, ChileCon
- Page 64 and 65: Ciudad Juarez, Chihuahua, MexicoGua
- Page 66 and 67: Matamoros, Tamaulipas, MexicoMexica
- Page 68 and 69: Reynosa, MexicoSaltillo, Coahuila,
- Page 70 and 71: Torreon, Coahulia, MexicoCaracas, V
- Page 72 and 73: Birmingham, AlabamaHuntsville, Deca
- Page 74 and 75: Jonesboro, ArkansasLittle Rock, Ark
- Page 76 and 77: Marin County, CaliforniaMonterey, C
- Page 78 and 79: Sacramento, CaliforniaSan Diego, Ca
- Page 80 and 81: Santa Clara County (Silicon Valley)
- Page 82 and 83:
Colorado Springs, ColoradoDenver, C
- Page 84 and 85:
Fort Lauderdale, FloridaFt. Myers/N
- Page 86 and 87:
Miami, FloridaOrlando, FloridaConta
- Page 88 and 89:
Atlanta, GeorgiaHonolulu, HawaiiCon
- Page 90 and 91:
Chicago, IllinoisSpringfield, Illin
- Page 92 and 93:
Cedar Rapids, Iowa City, IowaDavenp
- Page 94 and 95:
Wichita, KansasLexington, KentuckyC
- Page 96 and 97:
Monroe, LouisianaNew Orleans, Louis
- Page 98 and 99:
Suburban MarylandBoston, Massachuse
- Page 100 and 101:
Grand Rapids, MichiganLansing, Mich
- Page 102 and 103:
St. Louis, MissouriBozeman, Montana
- Page 104 and 105:
Omaha, NebraskaLas Vegas, NevadaCon
- Page 106 and 107:
Portsmouth, New HampshireAtlantic C
- Page 108 and 109:
Ocean/Monmouth Counties (“Shore M
- Page 110 and 111:
Las Cruces, New MexicoAlbany, New Y
- Page 112 and 113:
Asheville, North CarolinaCharlotte,
- Page 114 and 115:
Fargo, North DakotaAkron, OhioConta
- Page 116 and 117:
Cleveland, OhioColumbus, OhioContac
- Page 118 and 119:
Tulsa, OklahomaPortland, OregonCont
- Page 120 and 121:
Bucks County, PennsylvaniaHarrisbur
- Page 122 and 123:
Pittsburgh, PennsylvaniaSchuylkill
- Page 124 and 125:
Greenville/Spartanburg/Anderson Cou
- Page 126 and 127:
Knoxville, TennesseeMemphis, Tennes
- Page 128 and 129:
Beaumont, TexasCorpus Christi, Texa
- Page 130 and 131:
Fort Worth, TexasHouston, TexasCont
- Page 132 and 133:
Texarkana (Bowie County, Texas/Mill
- Page 134 and 135:
Northern VirginiaSeattle/Puget Soun
- Page 136 and 137:
Madison, WisconsinMilwaukee, Wiscon
- Page 138 and 139:
Jackson Hole, WyomingContactNAI Jac
- Page 140:
Build on the power of our network.N


