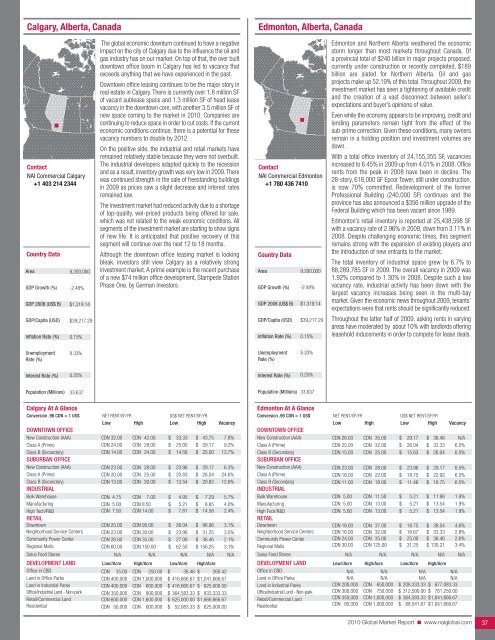
Calgary, Alberta, CanadaEdmonton, Alberta, CanadaContact<strong>NAI</strong> <strong>Commercial</strong> Calgary+1 403 214 2344Country DataAreaGDP Growth (%)GDP 2008 (US$ B)GDP/Capita (USD)Inflation Rate (%)9,200,000-2.48%$1,319.14$39,217.290.15%The global economic downturn continued to have a negativeimpact on the city of Calgary due to the influence the oil andgas industry has on our market. On top of that, the over builtdowntown office boom in Calgary has led to vacancy thatexceeds anything that we have experienced in the past.Downtown office leasing continues to be the major story inreal estate in Calgary. There is currently over 1.8 million SFof vacant sublease space and 1.3 million SF of head leasevacancy in the downtown core, with another 3.5 million SF ofnew space coming to the market in <strong>2010</strong>. Companies arecontinuing to reduce space in order to cut costs. If the currenteconomic conditions continue, there is a potential for thesevacancy numbers to double by 2012.On the positive side, the industrial and retail markets haveremained relatively stable because they were not overbuilt.The industrial developers adapted quickly to the recessionand as a result, inventory growth was very low in 2009. Therewas continued strength in the sale of freestanding buildingsin 2009 as prices saw a slight decrease and interest ratesremained low.The investment market had reduced activity due to a shortageof top-quality, wel-priced products being offered for sale,which was not related to the weak economic conditions. Allsegments of the investment market are starting to show signsof new life. It is anticipated that positive recovery of thissegment will continue over the next 12 to 18 months.Although the downtown office leasing market is lookingbleak, investors still view Calgary as a relatively stronginvestment market. A prime example is the recent purchaseof a new $74 million office development, Stampede StationPhase One, by German Investors.Contact<strong>NAI</strong> <strong>Commercial</strong> Edmonton+1 780 436 7410Country DataAreaGDP Growth (%)GDP 2008 (US$ B)GDP/Capita (USD)Inflation Rate (%)9,200,000-2.48%$1,319.14$39,217.290.15%Edmonton and Northern Alberta weathered the economicstorm longer than most markets throughout Canada. Ofa provincial total of $240 billion in major projects proposed,currently under construction or recently completed, $189billion are slated for Northern Alberta. Oil and gasprojects make up 52.19% of this total. Throughout 2009, theinvestment market has seen a tightening of available creditand the creation of a vast disconnect between seller’sexpectations and buyer’s opinions of value.Even while the economy appears to be improving, credit andlending parameters remain tight from the effect of thesub-prime correction. Given these conditions, many ownersremain in a holding position and investment volumes aredown.With a total office inventory of 24,155,355 SF, vacanciesincreased to 6.45% in 2009 up from 4.01% in 2008. Officerents from the peak in 2008 have been in decline. The28-story, 618,000 SF Epcor Tower, still under construction,is now 70% committed. Redevelopment of the formerProfessional Building (240,000 SF) continues and theprovince has also announced a $356 million upgrade of theFederal Building which has been vacant since 1989.Edmonton’s retail inventory is reported at 25,438,598 SFwith a vacancy rate of 2.96% in 2009, down from 3.11% in2008. Despite challenging economic times, this segmentremains strong with the expansion of existing players andthe introduction of new entrants to the market.The total inventory of industrial space grew by 6.7% to88,289,785 SF in 2009. The overall vacancy in 2009 was1.92% compared to 1.30% in 2008. Despite such a lowvacancy rate, industrial activity has been down with thelargest vacancy increases being seen in the multi-baymarket. Given the economic news throughout 2009, tenants’expectations were that rents should be significantly reduced.Throughout the latter half of 2009, asking rents in varyingareas have moderated by about 10% with landlords offeringleasehold inducements in order to compete for lease deals.UnemploymentRate (%)8.33%UnemploymentRate (%)8.33%Interest Rate (%)0.25%Interest Rate (%)0.25%Population (Millions)33.637Population (Millions)33.637Calgary At A GlanceConversion .96 CDN = 1 US$ NET RENT/SF/YR US$ NET RENT/SF/YRLow High Low High VacancyDOWNTOWN OFFICENew Construction (AAA)Class A (Prime)Class B (Secondary)SUBURBAN OFFICENew Construction (AAA)Class A (Prime)Class B (Secondary)INDUSTRIALBulk WarehouseManufacturingHigh Tech/R&DRETAILDowntownNeighborhood Service CentersCommunity Power CenterRegional MallsSolus Food StoresCDN 32.00 CDN 42.00 $ 33.33 $ 43.75 7.8%CDN 24.00 CDN 28.00 $ 25.00 $ 29.17 9.2%CDN 14.00 CDN 24.00 $ 14.58 $ 25.00 13.7%CDN 23.00 CDN 28.00 $ 23.96 $ 29.17 6.3%CDN 20.00 CDN 25.00 $ 20.83 $ 26.04 24.6%CDN 13.00 CDN 20.00 $ 13.54 $ 20.83 12.6%CDN 4.75 CDN 7.00 $ 4.95 $ 7.29 5.7%CDN 5.00 CDN 8.50 $ 5.21 $ 8.85 4.0%CDN 7.50 CDN 14.00 $ 7.81 $ 14.58 2.4%CDN 25.00 CDN 95.00 $ 26.04 $ 98.96 3.1%CDN 23.00 CDN 30.00 $ 23.96 $ 31.25 3.5%CDN 26.00 CDN 35.00 $ 27.08 $ 36.46 2.1%CDN 60.00 CDN 150.00 $ 62.50 $ 156.25 3.1%N/A N/A N/A N/A N/ADEVELOPMENT LAND Low//Acre High/Acre Low/Acre High/AcreOffice in CBDCDN 35.00 CDN 250.00 $ 36.46 $ 260.42Land in Office ParksCDN 400,000 CDN 1,000,000 $ 416,666.67 $1,041,666.67Land in Industrial ParksCDN 400,000 CDN 600,000 $ 416,666.67 $ 625,000.00Office/Industrial Land - Non-park CDN 350,000 CDN 800,000 $ 364,583.33 $ 833,333.33Retail/<strong>Commercial</strong> LandCDN 600,000 CDN 1,600,000 $ 625,000.00 $1,666,666.67ResidentialCDN 50,000 CDN 600,000 $ 52,083.33 $ 625,000.00Edmonton At A GlanceConversion .96 CDN = 1 US$ NET RENT/SF/YR US$ NET RENT/SF/YRLow High Low High VacancyDOWNTOWN OFFICENew Construction (AAA)Class A (Prime)Class B (Secondary)SUBURBAN OFFICENew Construction (AAA)Class A (Prime)Class B (Secondary)INDUSTRIALBulk WarehouseManufacturingHigh Tech/R&DRETAILDowntownNeighborhood Service CentersCommunity Power CenterRegional MallsSolus Food StoresCDN 28.00 CDN 35.00 $ 29.17 $ 36.46 N/ACDN 25.00 CDN 32.00 $ 26.04 $ 33.33 6.5%CDN 15.00 CDN 25.00 $ 15.63 $ 26.04 6.5%CDN 23.00 CDN 28.00 $ 23.96 $ 29.17 6.5%CDN 18.00 CDN 22.00 $ 18.75 $ 22.92 6.5%CDN 11.00 CDN 18.00 $ 11.46 $ 18.75 6.5%CDN 5.00 CDN 11.50 $ 5.21 $ 11.98 1.9%CDN 5.00 CDN 13.00 $ 5.21 $ 13.54 1.9%CDN 5.00 CDN 13.00 $ 5.21 $ 13.54 1.9%CDN 18.00 CDN 37.00 $ 18.75 $ 38.54 4.6%CDN 16.00 CDN 32.00 $ 16.67 $ 33.33 2.8%CDN 24.00 CDN 35.00 $ 25.00 $ 36.46 2.6%CDN 30.00 CDN 125.00 $ 31.25 $ 130.21 3.4%N/A N/A N/A N/A N/ADEVELOPMENT LAND Low//Acre High/Acre Low/Acre High/AcreOffice in CBDLand in Office ParksLand in Industrial ParksOffice/Industrial Land - Non-parkN/AN/ACDN 200,000CDN 300,000CDNCDNN/AN/A650,000750,000N/AN/A$ 208,333.33 $$ 312,500.00 $N/AN/A677,083.33781,250.00Retail/<strong>Commercial</strong> LandCDN 350,000 CDN 1,000,000 $ 364,583.33 $1,041,666.67ResidentialCDN 85,000 CDN 1,000,000 $ 88,541.67 $1,041,666.67<strong>2010</strong> <strong>Global</strong> <strong>Market</strong> <strong>Report</strong> ■ www.naiglobal.com 37
Vancouver, British Columbia, CanadaVictoria, British Columbia, CanadaContact<strong>NAI</strong> <strong>Commercial</strong>Vancouver+1 604 691 6643Country DataAreaGDP Growth (%)GDP 2008 (US$ B)GDP/Capita (USD)Inflation Rate (%)9,200,000-2.48%$1,319.14$39,217.290.15%Vancouver is the largest city in British Columbia and the thirdlargest in Canada. Metropolitan Vancouver is home to2.4 million people and is one of the largest ports on NorthAmerica’s west coast. Vancouver is set to host the <strong>2010</strong>Winter Olympics and expects 2.5% growth in the regionaleconomy for <strong>2010</strong>.Overall the region has fared better than most during 2009.The office market in the CBD has an overall vacancy rateof 7.0%, and absorption is expected to be negative untilmid-<strong>2010</strong>. In recent years, demand for high-rise residentialdevelopment sites in the urban core has led to reducedoffice space inventory with little new office product comingto market in <strong>2010</strong>-2011. The office markets in Richmond,Burnaby and Surrey have rebounded as tenants look to thesuburbs for space.The industrial market continues to outperform most otherCanadian industrial markets due to insufficient supply, withaverage vacancy rates of approximately 4%. Land pricesare expected to be stable in <strong>2010</strong>, ranging betweenC $750,000 and C $1.3 million/acre. Overall absorptionremains positive. Rental rates average C $8.00/SF net. Theretail market is under increasing pressure due to slowingconsumer spending. Steady population growth especially inthe CBD and near the rapid transit lines will keep this sectoractive in <strong>2010</strong>. <strong>Market</strong> rents will remain fairly stable as well.The investment market is recovering slowly. After five quartersof either flat or declining levels of investment activity, theGreater Vancouver property market showed signs of recoveryin Q3 2009.The multifamily market is particularly active with cap ratesof approximately 5.0%. Cap rates for most other producttypes range between 6.5% and 8.0% in the Vancouver regionand between 8.0% and 10% in secondary markets outsidethe Vancouver area depending on product type andlocation.Contact<strong>NAI</strong> <strong>Commercial</strong> Victoria+1 250 381 2265Country DataAreaGDP Growth (%)GDP 2008 (US$ B)GDP/Capita (USD)Inflation Rate (%)9,200,000-2.48%$1,319.14$39,217.290.15%Victoria, British Columbia, is the capital city of the Provinceof British Columbia, which employs some 10,000 people inthe downtown area. It has five primary economic drivers thatinclude the provincial government, the University of Victoria,high technology, tourism and the Department of NationalDefense, which operates Canada’s largest naval base onthe Pacific Coast.Since the fall of 2008, the provincial government has seena decline in revenue resulting in spending cuts. Tourism hasbeen damaged by a drop in both US and internationalvisitors. A relatively healthy local economy and low interestrates have resulted in a robust housing market that has seenincreases in sales volumes and strengthening of prices. Themedian single family house price is $500,000.The industrial market is challenging for buyers and tenantswith a very low vacancy rate of less than 1% and limitednew supply. Rents for industrial space have remained stable.Lack of capacity in existing industrial areas in the Victoriaarea continues to be a problem.The office market has seen an increase in vacancy rates. Anotable impact on the downtown office market has been thedownsizing of the provincial government as it struggles withits budget deficit. A new mall under construction anchoredby Wal-Mart includes an office component of 200,000 SF ofspace. It will be interesting to see how readily the marketabsorbs this new product in the current economic environment.The retail market in the downtown core continues to showweakness due to a diminished tourism sector. The 8%vacancy rate is expected to hold. Regional and communityretail centers in Victoria have a 2-3% vacancy rate withlease rates stable.Investment sales continue to be limited by a lack of product.An abundance of qualified purchasers and the limited numberof investment properties have resulted in capitalization ratesremaining resilient to the recessionary pressures. Prime commercialproperty capitalization rates are 6-7%. Residentialapartment capitalization rates are around 5%.UnemploymentRate (%)8.33%UnemploymentRate (%)8.33%Interest Rate (%)0.25%Interest Rate (%)0.25%Population (Millions)33.637Population (Millions)33.637Vancouver At A GlanceConversion .96 CDN = 1 US$ NET RENT/SF/YR US$ NET RENT/SF/YRLow High Low High VacancyDOWNTOWN OFFICENew Construction (AAA)Class A (Prime)Class B (Secondary)SUBURBAN OFFICENew Construction (AAA)Class A (Prime)Class B (Secondary)INDUSTRIALBulk WarehouseManufacturingHigh Tech/R&DRETAILDowntownNeighborhood Service CentersCommunity Power CenterRegional MallsSolus Food StoresCDN 30.00 CDN 40.00 $ 31.25 $ 41.67 5.0%CDN 28.00 CDN 38.00 $ 29.17 $ 39.58 6.0%CDN 25.00 CDN 33.00 $ 26.04 $ 34.38 8.0%CDN 29.00 CDN 35.00 $ 30.21 $ 36.46 8.0%CDN 25.00 CDN 32.00 $ 30.21 $ 36.46 7.5%CDN 20.00 CDN 25.00 $ 20.83 $ 26.04 12.0%CDN 6.00 CDN 9.00 $ 6.25 $ 9.38 4.0%CDN 6.50 CDN 10.00 $ 6.77 $ 10.42 4.0%CDN 8.50 CDN 14.00 $ 8.85 $ 14.58 4.5%CDN 105.00 CDN 180.00 $109.38 $187.50 4.0%CDN 30.00 CDN 60.00 $ 31.25 $ 62.50 4.0%CDN 30.00 CDN 40.00 $ 31.25 $ 41.67 4.5%CDN 25.00 CDN 40.00 $ 26.04 $ 41.67 4.5%N/A N/A N/A N/A N/ADEVELOPMENT LAND Low//Acre High/Acre Low/Acre High/AcreOffice in CBDCDN 75.00 CDN 135.00 $ 78.13 $ 140.63Land in Office ParksLand in Industrial ParksOffice/Industrial Land - Non-parkRetail/<strong>Commercial</strong> LandResidentialCDN 900,000CDN 850,000CDN 750,000CDN 750,000CDN 750,000CDN 1,300,000CDN 1,300,000CDN 1,200,000CDN 1,500,000CDN 1,500,000$$$$$937,500.00 $ 1,354,166.67885,416.67 $ 1,354,166.67781,250.00 $ 1,250,000.00781,250.00 $ 1,562,500.00781,250.00 $ 1,562,500.00Victoria At A GlanceConversion .96 CDN = 1 US$ NET RENT/SF/YR US$ NET RENT/SF/YRLow High Low High VacancyDOWNTOWN OFFICENew Construction (AAA)Class A (Prime)Class B (Secondary)SUBURBAN OFFICENew Construction (AAA)Class A (Prime)Class B (Secondary)INDUSTRIALBulk WarehouseManufacturingHigh Tech/R&DRETAILDowntownNeighborhood Service CentersCommunity Power CenterRegional MallsSolus Food StoresCDN 42.00 CDN 48.00 $ 43.75 $ 50.00 N/ACDN 36.00 CDN 40.00 $ 37.50 $ 41.67 1.8%CDN 30.00 CDN 34.00 $ 31.25 $ 35.42 5.0%CDN 38.00 CDN 42.00 $ 39.58 $ 43.75 N/ACDN 32.00 CDN 36.00 $ 33.33 $ 37.50 7.0%CDN 26.00 CDN 30.00 $ 27.08 $ 31.25 10.0%CDN 10.00 CDN 12.00 $ 10.42 $ 12.50 1.0%CDN 12.00 CDN 14.00 $ 12.50 $ 14.58 1.0%CDN 12.00 CDN 18.00 $ 12.50 $ 18.75 1.0%CDN 38.00 CDN 90.00 $ 39.58 $ 93.75 9.0%CDN 26.00 CDN 32.00 $ 27.08 $ 33.33 5.0%CDN 24.00 CDN 28.00 $ 25.00 $ 29.17 2.0%CDN 50.00 CDN 70.00 $ 52.08 $ 72.92 3.0%N/A N/A N/A N/A N/ADEVELOPMENT LAND Low//Acre High/Acre Low/Acre High/AcreOffice in CBDCDN 1,500,000 CDN 2,000,000 $1,562,500.00 $ 2,083,333.33Land in Office ParksCDN 600,000 CDN 1,000,000 $ 625,000.00 $ 1,041,666.67Land in Industrial ParksOffice/Industrial Land - Non-parkCDNCDN500,000 CDN600,000 CDN750,000900,000$$520,833.33625,000.00$$781,250.00937,500.00Retail/<strong>Commercial</strong> LandCDN 1,000,000 CDN 1,500,000 $1,041,666.67 $ 1,562,500.00ResidentialCDN 400,000 CDN 1,000,000 $ 416,666.67 $ 1,041,666.67<strong>2010</strong> <strong>Global</strong> <strong>Market</strong> <strong>Report</strong> ■ www.naiglobal.com 38
- Page 1 and 2: CommercialCommercial Real Estate Se
- Page 3 and 4: ■ ■ ■ Table of ContentsGENERA
- Page 5 and 6: Global OutlookCommercial real estat
- Page 7 and 8: 38.3% in November 2009. At the same
- Page 9 and 10: quality than the Census properties.
- Page 11 and 12: SaskatchewanSaskatchewan is a small
- Page 13 and 14: As 2009 draws to a close, there is
- Page 15 and 16: Global investment interest largely
- Page 18 and 19: ChinaChina continued to post large
- Page 20 and 21: MalaysiaWith Malaysia’s dependenc
- Page 22 and 23: ■ US Highlights - Northeast Regio
- Page 24 and 25: ■ US Highlights - Midwest Region
- Page 26 and 27: ■ US Highlights - West Region■
- Page 28 and 29: Melbourne, AustraliaBeijing, ChinaC
- Page 30 and 31: Shanghai, ChinaXiamen, ChinaContact
- Page 32 and 33: Delhi, Gurgaon, IndiaHyderabad, Pra
- Page 34 and 35: Punjab, IndiaTokyo, JapanContactNAI
- Page 36 and 37: Seoul, South KoreaTaipei, TaiwanCon
- Page 40 and 41: Halifax, Nova Scotia, CanadaOttawa,
- Page 42 and 43: Regina, Saskatchewan, CanadaContact
- Page 44 and 45: Vienna, AustriaThe Baltics (Latvia/
- Page 46 and 47: Copenhagen, DenmarkFinlandContactNA
- Page 48 and 49: Athens, GreeceReykjavik IcelandCont
- Page 50 and 51: KuwaitOslo, NorwayContactNAI Kuwait
- Page 52 and 53: Moscow, Russian FederationSt. Peter
- Page 54 and 55: Madrid, SpainStockholm, SwedenConta
- Page 56 and 57: Istanbul, TurkeyKiev, UkraineContac
- Page 58 and 59: Latin AmericaSECTION CONTENTSBuenos
- Page 60 and 61: Campinas, BrazilCuritiba, BrazilCon
- Page 62 and 63: Sao Paulo, BrazilSantiago, ChileCon
- Page 64 and 65: Ciudad Juarez, Chihuahua, MexicoGua
- Page 66 and 67: Matamoros, Tamaulipas, MexicoMexica
- Page 68 and 69: Reynosa, MexicoSaltillo, Coahuila,
- Page 70 and 71: Torreon, Coahulia, MexicoCaracas, V
- Page 72 and 73: Birmingham, AlabamaHuntsville, Deca
- Page 74 and 75: Jonesboro, ArkansasLittle Rock, Ark
- Page 76 and 77: Marin County, CaliforniaMonterey, C
- Page 78 and 79: Sacramento, CaliforniaSan Diego, Ca
- Page 80 and 81: Santa Clara County (Silicon Valley)
- Page 82 and 83: Colorado Springs, ColoradoDenver, C
- Page 84 and 85: Fort Lauderdale, FloridaFt. Myers/N
- Page 86 and 87: Miami, FloridaOrlando, FloridaConta
- Page 88 and 89:
Atlanta, GeorgiaHonolulu, HawaiiCon
- Page 90 and 91:
Chicago, IllinoisSpringfield, Illin
- Page 92 and 93:
Cedar Rapids, Iowa City, IowaDavenp
- Page 94 and 95:
Wichita, KansasLexington, KentuckyC
- Page 96 and 97:
Monroe, LouisianaNew Orleans, Louis
- Page 98 and 99:
Suburban MarylandBoston, Massachuse
- Page 100 and 101:
Grand Rapids, MichiganLansing, Mich
- Page 102 and 103:
St. Louis, MissouriBozeman, Montana
- Page 104 and 105:
Omaha, NebraskaLas Vegas, NevadaCon
- Page 106 and 107:
Portsmouth, New HampshireAtlantic C
- Page 108 and 109:
Ocean/Monmouth Counties (“Shore M
- Page 110 and 111:
Las Cruces, New MexicoAlbany, New Y
- Page 112 and 113:
Asheville, North CarolinaCharlotte,
- Page 114 and 115:
Fargo, North DakotaAkron, OhioConta
- Page 116 and 117:
Cleveland, OhioColumbus, OhioContac
- Page 118 and 119:
Tulsa, OklahomaPortland, OregonCont
- Page 120 and 121:
Bucks County, PennsylvaniaHarrisbur
- Page 122 and 123:
Pittsburgh, PennsylvaniaSchuylkill
- Page 124 and 125:
Greenville/Spartanburg/Anderson Cou
- Page 126 and 127:
Knoxville, TennesseeMemphis, Tennes
- Page 128 and 129:
Beaumont, TexasCorpus Christi, Texa
- Page 130 and 131:
Fort Worth, TexasHouston, TexasCont
- Page 132 and 133:
Texarkana (Bowie County, Texas/Mill
- Page 134 and 135:
Northern VirginiaSeattle/Puget Soun
- Page 136 and 137:
Madison, WisconsinMilwaukee, Wiscon
- Page 138 and 139:
Jackson Hole, WyomingContactNAI Jac
- Page 140:
Build on the power of our network.N


