

Organohalogen concentrations and a gross and histologic ...
Organohalogen concentrations and a gross and histologic ...
Organohalogen concentrations and a gross and histologic ...

You also want an ePaper? Increase the reach of your titles
YUMPU automatically turns print PDFs into web optimized ePapers that Google loves.
No. skulls collected<br />
50<br />
45<br />
40<br />
35<br />
30<br />
25<br />
20<br />
15<br />
10<br />
5<br />
0<br />
velopmental instability (i.e. the magnitude of FA) could have been initiated<br />
(e.g. Siegel <strong>and</strong> Doyle 1975a-c, Doyle et al., 1977, Siegel et al., 1977a). The<br />
model was successively reduced for non-significant interactions (p>0.05) <strong>and</strong><br />
the significance was evaluted from the remaining reduced model.<br />
2.5.6 FA versus contaminants<br />
For the 94 samples from 1999 to 2002 of which both skulls <strong>and</strong> contaminant<br />
analysis were available a non-parametric Spearman correlation coefficient<br />
was used to test for significant correlations between levels of individual<br />
organohalogens <strong>and</strong> FA. Due to the large numbers of tests (k=98) a Bonferroni<br />
correction of the p-estimates was applied to avoid the generation of<br />
significant results simply by chance. The critical alpha level was set to<br />
p=0.05/98=0.0005.<br />
3. Results<br />
3.1 The sample<br />
Before analysing the trend of FA between periods (before <strong>and</strong> after 1960)<br />
<strong>and</strong> age/sex groups, individuals were grouped as being adult males (≥6<br />
years), adult females (≥5 years) <strong>and</strong> the remaining individuals of both sexes<br />
as subadults (Table 2). The sample consisted of a total of 283 individuals<br />
distributed as 142 subadults, 78 adult males <strong>and</strong> 63 adult females (Table 2).<br />
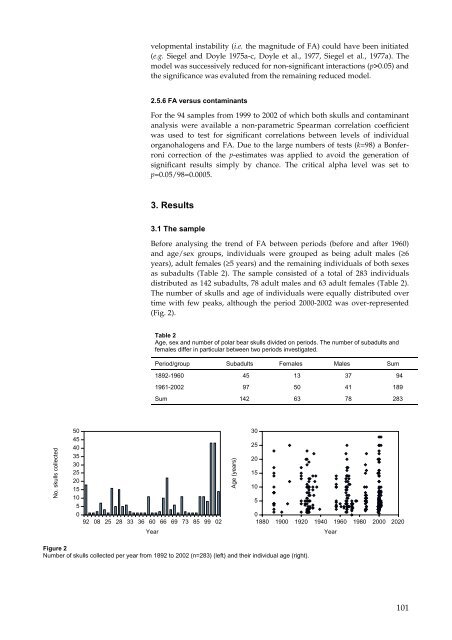
The number of skulls <strong>and</strong> age of individuals were equally distributed over<br />
time with few peaks, although the period 2000-2002 was over-represented<br />
(Fig. 2).<br />
92 08 25 28 33 36 60 66 69 73 85 99 02<br />
Year<br />
Table 2<br />
Age, sex <strong>and</strong> number of polar bear skulls divided on periods. The number of subadults <strong>and</strong><br />
females differ in particular between two periods investigated.<br />
Period/group Subadults Females Males Sum<br />
1892-1960 45 13 37 94<br />
1961-2002 97 50 41 189<br />
Sum 142 63 78 283<br />
Figure 2<br />
Number of skulls collected per year from 1892 to 2002 (n=283) (left) <strong>and</strong> their individual age (right).<br />
Age (years)<br />
30<br />
25<br />
20<br />
15<br />
10<br />
5<br />
0<br />
1880 1900 1920 1940 1960 1980 2000 2020<br />
Year<br />
101


