Organohalogen concentrations and a gross and histologic ...
Organohalogen concentrations and a gross and histologic ...
Organohalogen concentrations and a gross and histologic ...
You also want an ePaper? Increase the reach of your titles
YUMPU automatically turns print PDFs into web optimized ePapers that Google loves.
76<br />
small sample size <strong>and</strong> the effect of seasonal variation. However, there were<br />
tendencies for some compounds to have lower <strong>concentrations</strong> in females<br />
than in males. As no patterns could be detected in the <strong>concentrations</strong> of OCs<br />
relative to age in adult animals as observed in other studies (e.g. Norstrom<br />
et al., 1998), the animals were grouped into subadults bears of both sexes<br />
(below 5 years for females <strong>and</strong> below 6 years for males), adult females (5<br />
years old <strong>and</strong> above) <strong>and</strong> adult males (6 years old <strong>and</strong> above) for statistical<br />
analysis.<br />
ANOVA with the factors sex <strong>and</strong> age group (sub adult, adult females <strong>and</strong><br />
adult males), month (January, February, March, April-July, August <strong>and</strong><br />
September) <strong>and</strong> their interactions were performed to test for differences in<br />
mean OC <strong>concentrations</strong>. The least square estimates of the marginal means<br />
from the ANOVAs were back transformed to geometric means <strong>and</strong> plotted<br />
to illustrate the differences among months for each sex <strong>and</strong> agegroup (Fig.<br />
2). Multivariate analysis of variance (MANOVA, Wilks λ) were performed to<br />
investigate similarities in the patterns of OC (CBs, DDTs, HCHs, chlordane,<br />
chlorobenzene, dieldrin) <strong>concentrations</strong> among months <strong>and</strong> sex <strong>and</strong> age<br />
groups <strong>and</strong> their interactions. Similarities in the patterns among OC were<br />
further analysed by reorganising the data prior to ANOVA so that the dependent<br />
variable was ln-logarithmically transformed <strong>concentrations</strong> <strong>and</strong> the<br />
factors were OC compound, month, sex <strong>and</strong> age groups <strong>and</strong> all first order<br />
interactions. Statistical tests of type III were used for both the ANOVA <strong>and</strong><br />
the MANOVA.<br />
Data concerning OC <strong>concentrations</strong> in polar bears from central East Greenl<strong>and</strong><br />
sampled in 1990 (Norstrom et al. 1998) were made available courtesy of<br />
R. Norstrom (Dept. of Chemistry Carleton University, Ottawa) so that a<br />
comparison could be made of OC <strong>concentrations</strong> between 1990 <strong>and</strong> 1999-<br />
2001. An ANOVA on ln-logarithmically transformed <strong>concentrations</strong>, using<br />
sex <strong>and</strong> age group (subadult, adult female <strong>and</strong> adult males), sampling period<br />
<strong>and</strong> the interactions as factors, was applied to test for differences in<br />
mean OC <strong>concentrations</strong>. The least square estimates of the marginal means<br />
from the ANOVAs are used to illustrate the differences between the two<br />
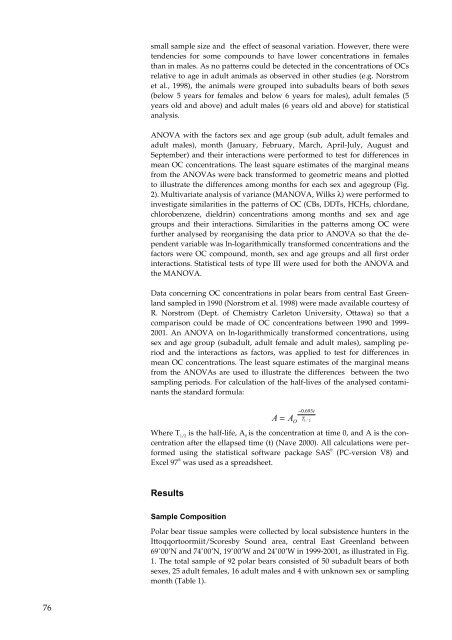
sampling periods. For calculation of the half-lives of the analysed contaminants<br />
the st<strong>and</strong>ard formula:<br />
A =<br />
−0.<br />
693t<br />
A T<br />
O 1 / 2<br />
Where T 1/2 is the half-life, A 0 is the concentration at time 0, <strong>and</strong> A is the concentration<br />
after the ellapsed time (t) (Nave 2000). All calculations were performed<br />
using the statistical software package SAS ® (PC-version V8) <strong>and</strong><br />
Excel 97 ® was used as a spreadsheet.<br />
Results<br />
Sample Composition<br />
Polar bear tissue samples were collected by local subsistence hunters in the<br />
Ittoqqortoormiit/Scoresby Sound area, central East Greenl<strong>and</strong> between<br />
69˚00’N <strong>and</strong> 74˚00’N, 19˚00’W <strong>and</strong> 24˚00’W in 1999-2001, as illustrated in Fig.<br />
1. The total sample of 92 polar bears consisted of 50 subadult bears of both<br />
sexes, 25 adult females, 16 adult males <strong>and</strong> 4 with unknown sex or sampling<br />
month (Table 1).


