

Organohalogen concentrations and a gross and histologic ...
Organohalogen concentrations and a gross and histologic ...
Organohalogen concentrations and a gross and histologic ...

You also want an ePaper? Increase the reach of your titles
YUMPU automatically turns print PDFs into web optimized ePapers that Google loves.
temperature extremes <strong>and</strong>/or food availability (e.g. Siegel <strong>and</strong> Doyle 1975ac,<br />
Doyle et al. 1977, Siegel et al. 1977a-b, Nilsson 1994, Carrascal et al. 1998).<br />
Higher climatic fluctuations (against higher temperature) in the first period<br />
(ca. 1930 <strong>and</strong> ca. 1960) could explain lower food availability <strong>and</strong> thereby a<br />
higher degree of developmental instability in the polar bears compared to<br />
the second period (Førl<strong>and</strong> 2002). However, a temperature effect is not<br />
likely, as temperatures above normal have been experienced in East Greenl<strong>and</strong><br />
during the last two decades which should limit the food resources<br />
(ringed seals) for the bears <strong>and</strong> thereby increase the FA (Ibid.).<br />
FA <strong>and</strong> organohalogen levels<br />
No clear pattern in the relationship between FA <strong>and</strong> individual level of organohalogens<br />
was found probably due to the large individual variability in<br />
contaminant levels, <strong>and</strong> because FA likely resulted from prenatal in utero<br />
disruptions <strong>and</strong> therefore rather related to contaminant exposure at the time<br />
of development than at the time of sampling. Few previous studies of<br />
mammals have linked FA to organohalogen contaminant <strong>concentrations</strong> on<br />
an individual by individual basis. Pertoldi et al. (1997) examined such correlations<br />
(DDTs <strong>and</strong> PCBs) in the Eurasian otter (Lutra lutra), but did not<br />
find a relationship between FA <strong>and</strong> individual contaminant burdens. The<br />
authors explained the lack of correlation by the high individual variability of<br />
organohalogens including seasonal patterns <strong>and</strong> sex differences which<br />
probably also is the case of the East Greenl<strong>and</strong> polar bear as discussed in<br />
Chapter 1. In addition, individual sensitivity may reduce such a pattern<br />
especially if the exposure range <strong>and</strong> number of examined individuals are<br />
low.<br />
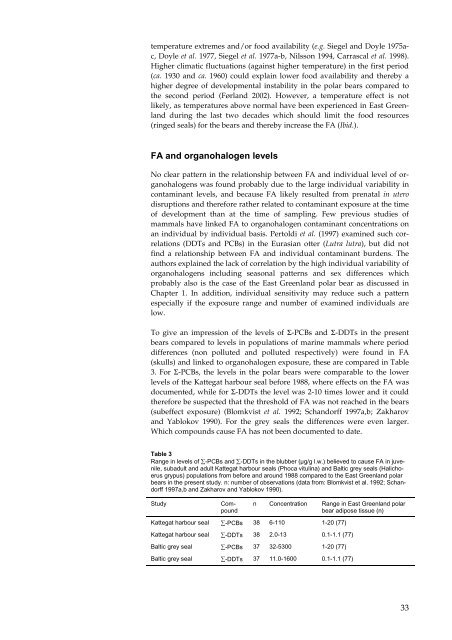
To give an impression of the levels of Σ-PCBs <strong>and</strong> Σ-DDTs in the present<br />
bears compared to levels in populations of marine mammals where period<br />
differences (non polluted <strong>and</strong> polluted respectively) were found in FA<br />
(skulls) <strong>and</strong> linked to organohalogen exposure, these are compared in Table<br />
3. For Σ-PCBs, the levels in the polar bears were comparable to the lower<br />
levels of the Kattegat harbour seal before 1988, where effects on the FA was<br />
documented, while for Σ-DDTs the level was 2-10 times lower <strong>and</strong> it could<br />
therefore be suspected that the threshold of FA was not reached in the bears<br />
(subeffect exposure) (Blomkvist et al. 1992; Sch<strong>and</strong>orff 1997a,b; Zakharov<br />
<strong>and</strong> Yablokov 1990). For the grey seals the differences were even larger.<br />
Which compounds cause FA has not been documented to date.<br />
Table 3<br />
Range in levels of ∑-PCBs <strong>and</strong> ∑-DDTs in the blubber (µg/g l.w.) believed to cause FA in juvenile,<br />
subadult <strong>and</strong> adult Kattegat harbour seals (Phoca vitulina) <strong>and</strong> Baltic grey seals (Halichoerus<br />
grypus) populations from before <strong>and</strong> around 1988 compared to the East Greenl<strong>and</strong> polar<br />
bears in the present study. n: number of observations (data from: Blomkvist et al. 1992; Sch<strong>and</strong>orff<br />
1997a,b <strong>and</strong> Zakharov <strong>and</strong> Yablokov 1990).<br />
Study Compound<br />
n Concentration Range in East Greenl<strong>and</strong> polar<br />
bear adipose tissue (n)<br />
Kattegat harbour seal ∑-PCBs 38 6-110 1-20 (77)<br />
Kattegat harbour seal ∑-DDTs 38 2.0-13 0.1-1.1 (77)<br />
Baltic grey seal ∑-PCBs 37 32-5300 1-20 (77)<br />
Baltic grey seal ∑-DDTs 37 11.0-1600 0.1-1.1 (77)<br />
33


