- Page 1 and 2:
National Environmental Research Ins
- Page 3 and 4:
National Environmental Research Ins
- Page 5 and 6:
Contents Summary 7 Resumé 11 Prefa
- Page 7 and 8:
Paper III-b Periodontitis and tooth
- Page 9 and 10:
Summary Marine mammals in the Arcti
- Page 11 and 12:
elations between histological chang
- Page 13 and 14:
Resumé Betydelige mængder svært
- Page 15 and 16:
signifikante relationer blev fundet
- Page 17 and 18:
Preface Since ca. 1960 signficant a
- Page 19 and 20:
Acquarone, Poul Johansen and Inge B
- Page 21 and 22:
Abbreviations ∑ Sum of congeners
- Page 23 and 24:
Introduction Study area and samplin
- Page 25 and 26:
content and composition) varying wi
- Page 27 and 28:
Of the PCBs found in the East Green
- Page 29 and 30:
son Bay bears while the difference
- Page 31 and 32:
Individual levels and biological ef
- Page 33 and 34:
No. skulls collected 50 45 40 35 30
- Page 35 and 36:
temperature extremes and/or food av
- Page 37 and 38:
Chapter 3 Bone mineral density and
- Page 39 and 40:
BMD analysed by DXA reflects the ar
- Page 41 and 42:
Table 4 Range in the levels (ng/g l
- Page 43 and 44:
Chapter 4 Liver histology of East G
- Page 45 and 46:
Table 7 Levels of ∑-PCBs, ∑-DDT
- Page 47 and 48:
Frequency (%) 100 80 60 40 20 Sever
- Page 49 and 50:
Effects of PBBs (PolyBrominated Bip
- Page 51 and 52:
Etiology and pathogenesis E Figure
- Page 53 and 54: common sign (Acland 1995, Feldman 1
- Page 55 and 56: Conclusions and final assessments O
- Page 57 and 58: of CYP-450 activity that impact cir
- Page 59 and 60: Regarding renal tissue, we will try
- Page 61 and 62: Bernhoft, A., Ø. Wiig and J. U. Sk
- Page 63 and 64: Feldman, E. C. (1995): Hyperadrenoc
- Page 65 and 66: (eds.): Ringed seals in the North A
- Page 67 and 68: McCormack, K. M., W. M. Kluwe, V. L
- Page 69 and 70: Rosing-Asvid, A., E. W. Born and M.
- Page 71 and 72: Valentino, R., S. Savastano, A. P.
- Page 73 and 74: Paper I Seasonal and temporal trend
- Page 75 and 76: eproductive rates of seals in the B
- Page 77 and 78: concentrations of the 41 individual
- Page 79 and 80: Figure 1 Capture locations of the p
- Page 81 and 82: Table 4 Results of ANOVAs (F-value
- Page 83 and 84: Long-Term Temporal Changes in OC Co
- Page 85 and 86: Discussion Geographical Variation i
- Page 87 and 88: sen et al. (2001) studied the trend
- Page 89 and 90: higher than reported in other studi
- Page 91 and 92: Bergman A, Olsson M. Pathology of b
- Page 93 and 94: Muir D, Norstrom RJ. Geographical d
- Page 95 and 96: Wiig Ø, Gjertz I, Hansson R, Thoma
- Page 97 and 98: Key words: polar bear, Ursus mariti
- Page 99 and 100: 2. Materials and methods 2.1 Sampli
- Page 101 and 102: 2.3 Age Determination The age deter
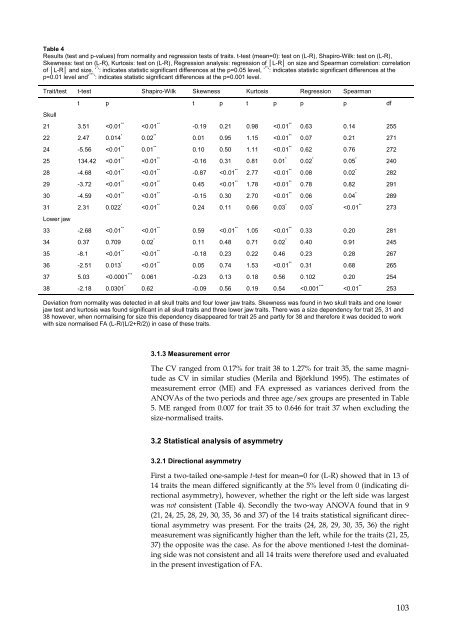
- Page 103: No. skulls collected 50 45 40 35 30
- Page 107 and 108: Table 6 Results from F-tests (p-val
- Page 109 and 110: (oxy-chlordane, trans-chlordane, ci
- Page 111 and 112: Also Pertoldi et al. (1997) investi
- Page 113 and 114: study could not document a relation
- Page 115 and 116: Lie E, Bernhoft A, Riget FF, Beliko
- Page 117 and 118: function in harbour seals (Phoca vi
- Page 119 and 120: (p=0.94). Negative correlation betw
- Page 121 and 122: Osteodensitometry X-ray osteodensit
- Page 123 and 124: Figure 2 BMD (g cm 2 ) in skulls fr
- Page 125 and 126: Table 3 Significant results from th
- Page 127 and 128: 2003) and plasma retinol and thyroi
- Page 129 and 130: Comiso JC. 2002. A rapidly declinin
- Page 131 and 132: Manalagas SC, Jilka RJ. 1995. Bone
- Page 133 and 134: Valentine DW, Soulé M. 1973. Effec
- Page 135 and 136: have the potential for adverse heal
- Page 137 and 138: Dioxin-like contaminants Extraction
- Page 139 and 140: Concentration 9000 8000 7000 6000 5
- Page 141 and 142: Acknowledgements Danish Cooperation
- Page 143 and 144: Polischuk, S. C., R. J. Letcher, R.
- Page 145 and 146: Paper IV Liver histology of free-ra
- Page 147 and 148: Histology All tissue samples were t
- Page 149 and 150: Figure 1 Hepatic lipid accumulation
- Page 151 and 152: Figure 2 Left: Portal mononuclear c
- Page 153 and 154: Relationship between histology and
- Page 155 and 156:
kinson 1996). Due to these mechanis
- Page 157 and 158:
sues. Arctic Monitoring and Assessm
- Page 159 and 160:
van Duursen, M.B.M., Sanderson, J.
- Page 161 and 162:
Introduction Polar bears (Ursus mar
- Page 163 and 164:
Briefly, ∑PCBs is the sum (s) of
- Page 165 and 166:
Figure 1 Bottom: example of glomeru
- Page 167 and 168:
Figure 3 Tubular cell proliferation
- Page 169 and 170:
Hyalin casts Hyalin casts were eval
- Page 171 and 172:
Figure 6 Hyperemia (arrows) in the
- Page 173 and 174:
al., 2003). We did not find such a
- Page 175 and 176:
ANDERSEN, M., E. LIE, A. E. DEROCHE
- Page 177 and 178:
LUROSS, J. M., M. ALAEE, D. B. SERG
- Page 179 and 180:
organic mercury in liver and kidney
- Page 181 and 182:
Introduction Polar bears (Ursus mar
- Page 183 and 184:
Macroscopic examination of reproduc
- Page 185 and 186:
Results and discussion The female p
- Page 187 and 188:
SC II PC/LC Figure 2 The histology
- Page 189 and 190:
The relatively low levels of analys
- Page 191 and 192:
(Table 4), and we therefore conclud
- Page 193 and 194:
Acknowledgements Danish Cooperation
- Page 195 and 196:
Letcher RJ, Klasson-Wehler E, Bergm
- Page 197 and 198:
Swart RL, Ross PS, Vedder LJ, Timme
- Page 199 and 200:
10. Heier, A., C. Sonne, A. Gröne,
- Page 201 and 202:
crine organs and skulls in the East
- Page 203:
To investigate the relation between