

Organohalogen concentrations and a gross and histologic ...
Organohalogen concentrations and a gross and histologic ...
Organohalogen concentrations and a gross and histologic ...

Create successful ePaper yourself
Turn your PDF publications into a flip-book with our unique Google optimized e-Paper software.
102<br />
3.1.1 Normality<br />
Basic statistics for the 14 FA traits are shown in Table 3. Deviation from normality<br />
could be detected in 12 of the 14 traits (Table 4). To further investigate<br />
the deviations from normality the data was analysed for skewness <strong>and</strong> kurtosis<br />
(Table 4). Asymmetric distributions (skewness) could be significantly detected<br />
in 3 traits; two traits (29 <strong>and</strong> 32) were skewed to the right <strong>and</strong> one trait<br />
(28) was skewed to the left side. Kurtosis were found significant in 11 traits,<br />
<strong>and</strong> in all cases the distribution was leptokurtic (a distribution having many<br />
values around the mean <strong>and</strong> in the “tails”, far from the mean) (Table 4). The 3<br />
significant traits from test for skewness showed divergent <strong>and</strong> no consisting<br />
left-right trends against a single side. As the assumption of normality of the<br />
data in several cases could be doubted, both parametric <strong>and</strong> non-parametric<br />
statistical tests were performed in further analysis.<br />
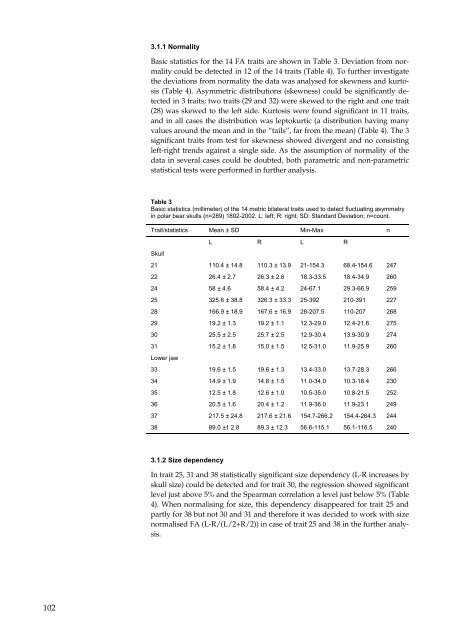
Table 3<br />
Basic statistics (millimeter) of the 14 metric bilateral traits used to detect fluctuating asymmetry<br />
in polar bear skulls (n=289) 1892-2002. L: left; R: right; SD: St<strong>and</strong>ard Deviation; n=count.<br />
Trait/statistics Mean ± SD Min-Max n<br />
L R L R<br />
Skull<br />
21 110.4 ± 14.8 110.3 ± 13.9 21-154.3 68.4-154.6 247<br />
22 26.4 ± 2.7 26.3 ± 2.6 18.3-33.5 18.4-34.9 260<br />
24 58 ± 4.6 58.4 ± 4.2 24-67.1 29.3-66.9 259<br />
25 325.6 ± 38.8 326.3 ± 33.3 25-392 210-391 227<br />
28 166.9 ± 18.9 167.6 ± 16.9 28-207.5 110-207 268<br />
29 19.2 ± 1.3 19.2 ± 1.1 12.3-29.0 12.4-21.6 275<br />
30 25.5 ± 2.5 25.7 ± 2.5 12.9-30.4 13.9-30.9 274<br />
31<br />
Lower jaw<br />
15.2 ± 1.8 15.0 ± 1.5 12.5-31.0 11.9-25.9 260<br />
33 19.6 ± 1.5 19.6 ± 1.3 13.4-33.0 13.7-28.3 266<br />
34 14.9 ± 1.9 14.8 ± 1.5 11.0-34.0 10.3-18.4 230<br />
35 12.5 ± 1.8 12.6 ± 1.0 10.5-35.0 10.8-21.5 252<br />
36 20.5 ± 1.6 20.4 ± 1.2 11.9-36.0 11.9-23.1 249<br />
37 217.5 ± 24.8 217.6 ± 21.6 154.7-266.2 154.4-264.3 244<br />
38 89.0 ±1 2.8 89.3 ± 12.3 56.6-115.1 56.1-116.5 240<br />
3.1.2 Size dependency<br />
In trait 25, 31 <strong>and</strong> 38 statistically significant size dependency (L-R increases by<br />
skull size) could be detected <strong>and</strong> for trait 30, the regression showed significant<br />
level just above 5% <strong>and</strong> the Spearman correlation a level just below 5% (Table<br />
4). When normalising for size, this dependency disappeared for trait 25 <strong>and</strong><br />
partly for 38 but not 30 <strong>and</strong> 31 <strong>and</strong> therefore it was decided to work with size<br />
normalised FA (L-R/(L/2+R/2)) in case of trait 25 <strong>and</strong> 38 in the further analysis.


