SACS Compliance Certification Report (PDF) - South Florida State ...
SACS Compliance Certification Report (PDF) - South Florida State ...
SACS Compliance Certification Report (PDF) - South Florida State ...

You also want an ePaper? Increase the reach of your titles
YUMPU automatically turns print PDFs into web optimized ePapers that Google loves.
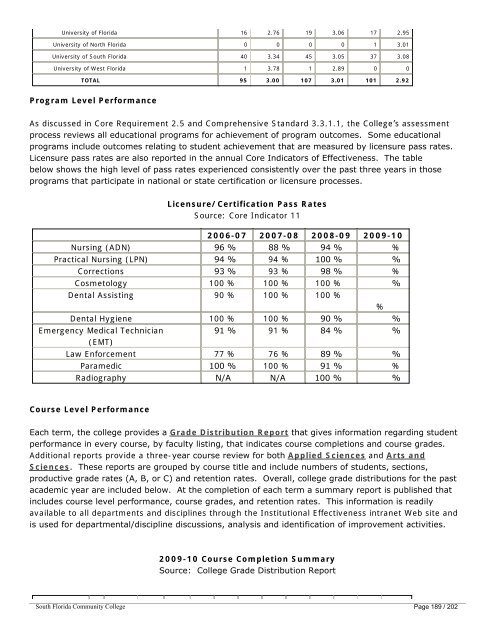
Spring 2010 N 3651 2445 1285 465 875 64 524 2 16 646 79 10052<strong>Florida</strong> <strong>State</strong> University 3 3.59 3 2.59 10 2.56University of Central <strong>Florida</strong> 21 2.48 17 3.09 15 2.81University of <strong>Florida</strong> 16 2.76 19 3.06 17 2.95University of North <strong>Florida</strong> 0 0 0 0 1 3.01University of <strong>South</strong> <strong>Florida</strong> 40 3.34 45 3.05 37 3.08University of West <strong>Florida</strong> 1 3.78 1 2.89 0 0TOTAL 95 3.00 107 3.01 101 2.92Program Level PerformanceAs discussed in Core Requirement 2.5 and Comprehensive Standard 3.3.1.1, the College’s assessmentprocess reviews all educational programs for achievement of program outcomes. Some educationalprograms include outcomes relating to student achievement that are measured by licensure pass rates.Licensure pass rates are also reported in the annual Core Indicators of Effectiveness. The tablebelow shows the high level of pass rates experienced consistently over the past three years in thoseprograms that participate in national or state certification or licensure processes.Licensure/<strong>Certification</strong> Pass RatesSource: Core Indicator 112006-07 2007-08 2008-09 2009-10Nursing (ADN) 96 % 88 % 94 % %Practical Nursing (LPN) 94 % 94 % 100 % %Corrections 93 % 93 % 98 % %Cosmetology 100 % 100 % 100 % %Dental Assisting 90 % 100 % 100 %Dental Hygiene 100 % 100 % 90 % %Emergency Medical Technician(EMT)91 % 91 % 84 % %Law Enforcement 77 % 76 % 89 % %Paramedic 100 % 100 % 91 % %Radiography N/A N/A 100 % %%Course Level PerformanceEach term, the college provides a Grade Distribution <strong>Report</strong> that gives information regarding studentperformance in every course, by faculty listing, that indicates course completions and course grades.Additional reports provide a three-year course review for both Applied Sciences and Arts andSciences. These reports are grouped by course title and include numbers of students, sections,productive grade rates (A, B, or C) and retention rates. Overall, college grade distributions for the pastacademic year are included below. At the completion of each term a summary report is published thatincludes course level performance, course grades, and retention rates. This information is readilyavailable to all departments and disciplines through the Institutional Effectiveness intranet Web site andis used for departmental/discipline discussions, analysis and identification of improvement activities.2009-10 Course Completion SummarySource: College Grade Distribution <strong>Report</strong>Term A B C D F I W X N P S Total<strong>South</strong> <strong>Florida</strong> Community College Page 189 / 202Fall 2009 N 3481 2486 1332 428 718 111 528 2 22 748 79 9935% 35.04 25.02 13.41 4.31 7.23 1.12 5.31 0.02 0.22 7.53 0.80