2007-08 - Aditya Birla Nuvo, Ltd
2007-08 - Aditya Birla Nuvo, Ltd
2007-08 - Aditya Birla Nuvo, Ltd
- No tags were found...

Create successful ePaper yourself
Turn your PDF publications into a flip-book with our unique Google optimized e-Paper software.
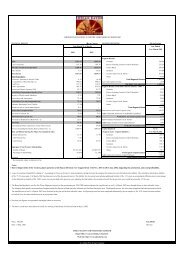
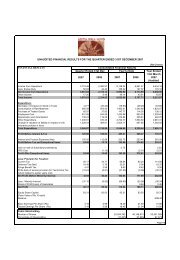
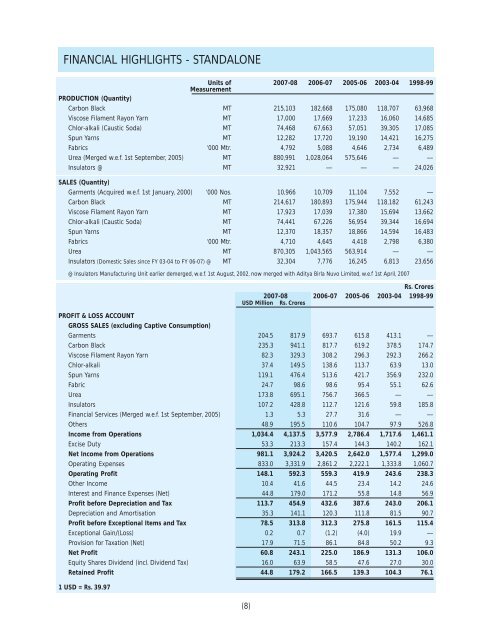
FINANCIAL HIGHLIGHTS - STANDALONEUnits of <strong>2007</strong>-<strong>08</strong> 2006-07 2005-06 2003-04 1998-99MeasurementPRODUCTION (Quantity)Carbon Black MT 215,103 182,668 175,<strong>08</strong>0 118,707 63,968Viscose Filament Rayon Yarn MT 17,000 17,669 17,233 16,060 14,685Chlor-alkali (Caustic Soda) MT 74,468 67,663 57,051 39,305 17,<strong>08</strong>5Spun Yarns MT 12,282 17,720 19,190 14,421 16,275Fabrics ‘000 Mtr. 4,792 5,<strong>08</strong>8 4,646 2,734 6,489Urea (Merged w.e.f. 1st September, 2005) MT 880,991 1,028,064 575,646 — —Insulators @ MT 32,921 — — — 24,026SALES (Quantity)Garments (Acquired w.e.f. 1st January, 2000) ‘000 Nos. 10,966 10,709 11,104 7,552 —Carbon Black MT 214,617 180,893 175,944 118,182 61,243Viscose Filament Rayon Yarn MT 17,923 17,039 17,380 15,694 13,662Chlor-alkali (Caustic Soda) MT 74,441 67,226 56,954 39,344 16,694Spun Yarns MT 12,370 18,357 18,866 14,594 16,483Fabrics ‘000 Mtr. 4,710 4,645 4,418 2,798 6,380Urea MT 870,305 1,043,565 563,914 — —Insulators (Domestic Sales since FY 03-04 to FY 06-07) @ MT 32,304 7,776 16,245 6,813 23,656@ Insulators Manufacturing Unit earlier demerged, w.e.f. 1st August, 2002, now merged with <strong>Aditya</strong> <strong>Birla</strong> <strong>Nuvo</strong> Limited, w.e.f 1st April, <strong>2007</strong>Rs. Crores<strong>2007</strong>-<strong>08</strong> 2006-07 2005-06 2003-04 1998-99USD Million Rs. CroresPROFIT & LOSS ACCOUNTGROSS SALES (excluding Captive Consumption)Garments 204.5 817.9 693.7 615.8 413.1 —Carbon Black 235.3 941.1 817.7 619.2 378.5 174.7Viscose Filament Rayon Yarn 82.3 329.3 3<strong>08</strong>.2 296.3 292.3 266.2Chlor-alkali 37.4 149.5 138.6 113.7 63.9 13.0Spun Yarns 119.1 476.4 513.6 421.7 356.9 232.0Fabric 24.7 98.6 98.6 95.4 55.1 62.6Urea 173.8 695.1 756.7 366.5 — —Insulators 107.2 428.8 112.7 121.6 59.8 185.8Financial Services (Merged w.e.f. 1st September, 2005) 1.3 5.3 27.7 31.6 — —Others 48.9 195.5 110.6 104.7 97.9 526.8Income from Operations 1,034.4 4,137.5 3,577.9 2,786.4 1,717.6 1,461.1Excise Duty 53.3 213.3 157.4 144.3 140.2 162.1Net Income from Operations 981.1 3,924.2 3,420.5 2,642.0 1,577.4 1,299.0Operating Expenses 833.0 3,331.9 2,861.2 2,222.1 1,333.8 1,060.7Operating Profit 148.1 592.3 559.3 419.9 243.6 238.3Other Income 10.4 41.6 44.5 23.4 14.2 24.6Interest and Finance Expenses (Net) 44.8 179.0 171.2 55.8 14.8 56.9Profit before Depreciation and Tax 113.7 454.9 432.6 387.6 243.0 206.1Depreciation and Amortisation 35.3 141.1 120.3 111.8 81.5 90.7Profit before Exceptional Items and Tax 78.5 313.8 312.3 275.8 161.5 115.4Exceptional Gain/(Loss) 0.2 0.7 (1.2) (4.0) 19.9 —Provision for Taxation (Net) 17.9 71.5 86.1 84.8 50.2 9.3Net Profit 60.8 243.1 225.0 186.9 131.3 106.0Equity Shares Dividend (incl. Dividend Tax) 16.0 63.9 58.5 47.6 27.0 30.0Retained Profit 44.8 179.2 166.5 139.3 104.3 76.11 USD = Rs. 39.97(8)