2007-08 - Aditya Birla Nuvo, Ltd
2007-08 - Aditya Birla Nuvo, Ltd
2007-08 - Aditya Birla Nuvo, Ltd
- No tags were found...

Create successful ePaper yourself
Turn your PDF publications into a flip-book with our unique Google optimized e-Paper software.
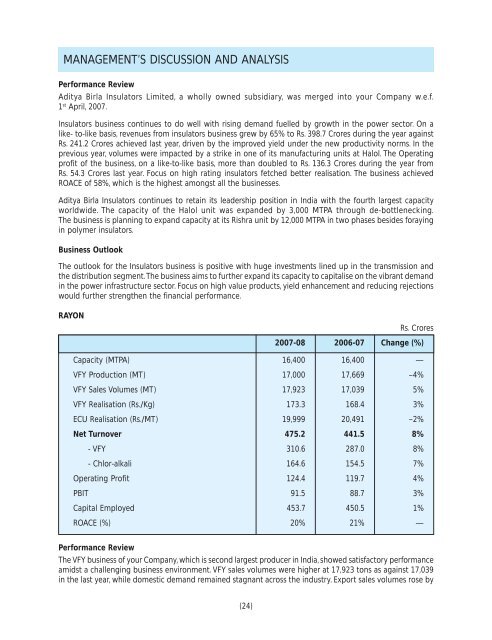
MANAGEMENT’S DISCUSSION AND ANALYSISPerformance Review<strong>Aditya</strong> <strong>Birla</strong> Insulators Limited, a wholly owned subsidiary, was merged into your Company w.e.f.1 st April, <strong>2007</strong>.Insulators business continues to do well with rising demand fuelled by growth in the power sector. On alike- to-like basis, revenues from insulators business grew by 65% to Rs. 398.7 Crores during the year againstRs. 241.2 Crores achieved last year, driven by the improved yield under the new productivity norms. In theprevious year, volumes were impacted by a strike in one of its manufacturing units at Halol. The Operatingprofit of the business, on a like-to-like basis, more than doubled to Rs. 136.3 Crores during the year fromRs. 54.3 Crores last year. Focus on high rating insulators fetched better realisation. The business achievedROACE of 58%, which is the highest amongst all the businesses.<strong>Aditya</strong> <strong>Birla</strong> Insulators continues to retain its leadership position in India with the fourth largest capacityworldwide. The capacity of the Halol unit was expanded by 3,000 MTPA through de-bottlenecking.The business is planning to expand capacity at its Rishra unit by 12,000 MTPA in two phases besides forayingin polymer insulators.Business OutlookThe outlook for the Insulators business is positive with huge investments lined up in the transmission andthe distribution segment. The business aims to further expand its capacity to capitalise on the vibrant demandin the power infrastructure sector. Focus on high value products, yield enhancement and reducing rejectionswould further strengthen the financial performance.RAYONRs. Crores<strong>2007</strong>-<strong>08</strong> 2006-07 Change (%)Capacity (MTPA) 16,400 16,400 —VFY Production (MT) 17,000 17,669 –4%VFY Sales Volumes (MT) 17,923 17,039 5%VFY Realisation (Rs./Kg) 173.3 168.4 3%ECU Realisation (Rs./MT) 19,999 20,491 –2%Net Turnover 475.2 441.5 8%- VFY 310.6 287.0 8%- Chlor-alkali 164.6 154.5 7%Operating Profit 124.4 119.7 4%PBIT 91.5 88.7 3%Capital Employed 453.7 450.5 1%ROACE (%) 20% 21% —Performance ReviewThe VFY business of your Company, which is second largest producer in India, showed satisfactory performanceamidst a challenging business environment. VFY sales volumes were higher at 17,923 tons as against 17,039in the last year, while domestic demand remained stagnant across the industry. Export sales volumes rose by(24)