2007-08 - Aditya Birla Nuvo, Ltd
2007-08 - Aditya Birla Nuvo, Ltd
2007-08 - Aditya Birla Nuvo, Ltd
- No tags were found...

Create successful ePaper yourself
Turn your PDF publications into a flip-book with our unique Google optimized e-Paper software.
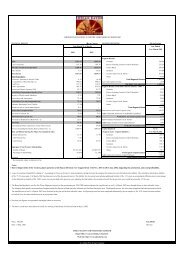
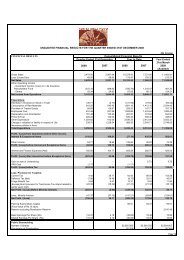
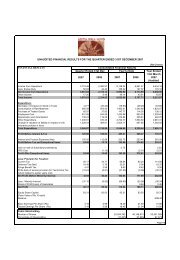
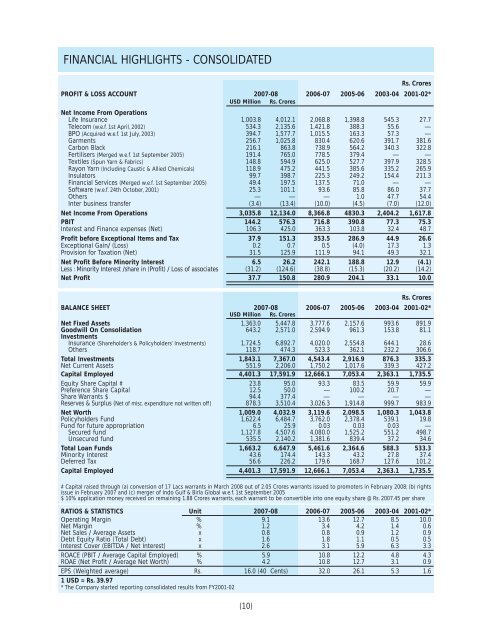
FINANCIAL HIGHLIGHTS - CONSOLIDATEDRs. CroresPROFIT & LOSS ACCOUNT <strong>2007</strong>-<strong>08</strong> 2006-07 2005-06 2003-04 2001-02*USD Million Rs. CroresNet Income From OperationsLife Insurance 1,003.8 4,012.1 2,068.8 1,398.8 545.3 27.7Telecom (w.e.f. 1st April, 2002) 534.3 2,135.6 1,421.8 388.3 55.6 —BPO (Acquired w.e.f. 1st July, 2003) 394.7 1,577.7 1,015.5 163.3 57.3 —Garments 256.7 1,025.8 830.4 620.6 391.7 381.6Carbon Black 216.1 863.8 738.9 564.2 340.3 322.8Fertilisers (Merged w.e.f. 1st September 2005) 191.4 765.0 778.5 379.4 — —Textiles (Spun Yarn & Fabrics) 148.8 594.9 625.0 527.7 397.9 328.5Rayon Yarn (Including Caustic & Allied Chemicals) 118.9 475.2 441.5 385.6 335.2 265.9Insulators 99.7 398.7 225.3 249.2 154.4 211.3Financial Services (Merged w.e.f. 1st September 2005) 49.4 197.5 137.5 71.0 — —Software (w.e.f. 24th October, 2001) 25.3 101.1 93.6 85.8 86.0 37.7Others — — — 1.0 47.7 54.4Inter business transfer (3.4) (13.4) (10.0) (4.5) (7.0) (12.0)Net Income From Operations 3,035.8 12,134.0 8,366.8 4830.3 2,404.2 1,617.8PBIT 144.2 576.3 716.8 390.8 77.3 75.3Interest and Finance expenses (Net) 106.3 425.0 363.3 103.8 32.4 48.7Profit before Exceptional Items and Tax 37.9 151.3 353.5 286.9 44.9 26.6Exceptional Gain/ (Loss) 0.2 0.7 0.5 (4.0) 17.3 1.3Provision for Taxation (Net) 31.5 125.9 111.9 94.1 49.3 32.1Net Profit Before Minority Interest 6.5 26.2 242.1 188.8 12.9 (4.1)Less : Minority Interest /share in (Profit) / Loss of associates (31.2) (124.6) (38.8) (15.3) (20.2) (14.2)Net Profit 37.7 150.8 280.9 204.1 33.1 10.0Rs. CroresBALANCE SHEET <strong>2007</strong>-<strong>08</strong> 2006-07 2005-06 2003-04 2001-02*USD Million Rs. CroresNet Fixed Assets 1,363.0 5,447.8 3,777.6 2,157.6 993.6 891.9Goodwill On Consolidation 643.2 2,571.0 2,594.9 961.3 153.8 81.1InvestmentsInsurance (Shareholder’s & Policyholders’ Investments) 1,724.5 6,892.7 4,020.0 2,554.8 644.1 28.6Others 118.7 474.3 523.3 362.1 232.2 306.6Total Investments 1,843.1 7,367.0 4,543.4 2,916.9 876.3 335.3Net Current Assets 551.9 2,206.0 1,750.2 1,017.6 339.3 427.2Capital Employed 4,401.3 17,591.9 12,666.1 7,053.4 2,363.1 1,735.5Equity Share Capital # 23.8 95.0 93.3 83.5 59.9 59.9Preference Share Capital 12.5 50.0 — 100.2 20.7 —Share Warrants $ 94.4 377.4 — — — —Reserves & Surplus (Net of misc. expenditure not written off ) 878.3 3,510.4 3,026.3 1,914.8 999.7 983.9Net Worth 1,009.0 4,032.9 3,119.6 2,098.5 1,<strong>08</strong>0.3 1,043.8Policyholders Fund 1,622.4 6,484.7 3,762.0 2,378.4 539.1 19.8Fund for future appropriation 6.5 25.9 0.03 0.03 0.03 —Secured fund 1,127.8 4,507.6 4,<strong>08</strong>0.0 1,525.2 551.2 498.7Unsecured fund 535.5 2,140.2 1,381.6 839.4 37.2 34.6Total Loan Funds 1,663.2 6,647.9 5,461.6 2,364.6 588.3 533.3Minority Interest 43.6 174.4 143.3 43.2 27.8 37.4Deferred Tax 56.6 226.2 179.6 168.7 127.6 101.2Capital Employed 4,401.3 17,591.9 12,666.1 7,053.4 2,363.1 1,735.5# Capital raised through (a) conversion of 17 Lacs warrants in March 20<strong>08</strong> out of 2.05 Crores warrants issued to promoters in February 20<strong>08</strong>; (b) rightsissue in February <strong>2007</strong> and (c) merger of Indo Gulf & <strong>Birla</strong> Global w.e.f. 1st September 2005$ 10% application money received on remaining 1.88 Crores warrants, each warrant to be convertible into one equity share @ Rs. <strong>2007</strong>.45 per shareRATIOS & STATISTICS Unit <strong>2007</strong>-<strong>08</strong> 2006-07 2005-06 2003-04 2001-02*Operating Margin % 9.1 13.6 12.7 8.5 10.0Net Margin % 1.2 3.4 4.2 1.4 0.6Net Sales / Average Assets x 0.8 0.8 0.9 1.2 0.9Debt Equity Ratio (Total Debt) x 1.6 1.8 1.1 0.5 0.5Interest Cover (EBITDA / Net Interest) x 2.6 3.1 5.9 6.3 3.3ROACE (PBIT / Average Capital Employed) % 5.9 10.8 12.2 4.8 4.3ROAE (Net Profit / Average Net Worth) % 4.2 10.8 12.7 3.1 0.9EPS (Weighted average) Rs. 16.0 (40 Cents) 32.0 26.1 5.3 1.61 USD = Rs. 39.97* The Company started reporting consolidated results from FY2001-02(10)