2007-08 - Aditya Birla Nuvo, Ltd
2007-08 - Aditya Birla Nuvo, Ltd
2007-08 - Aditya Birla Nuvo, Ltd
- No tags were found...

Create successful ePaper yourself
Turn your PDF publications into a flip-book with our unique Google optimized e-Paper software.
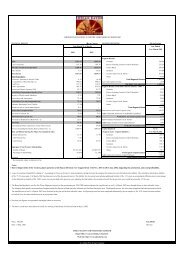
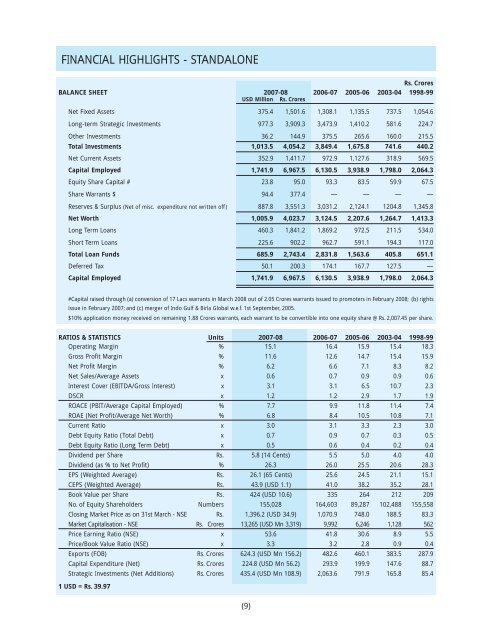
FINANCIAL HIGHLIGHTS - STANDALONERs. CroresBALANCE SHEET <strong>2007</strong>-<strong>08</strong> 2006-07 2005-06 2003-04 1998-99USD Million Rs. CroresNet Fixed Assets 375.4 1,501.6 1,3<strong>08</strong>.1 1,135.5 737.5 1,054.6Long-term Strategic Investments 977.3 3,909.3 3,473.9 1,410.2 581.6 224.7Other Investments 36.2 144.9 375.5 265.6 160.0 215.5Total Investments 1,013.5 4,054.2 3,849.4 1,675.8 741.6 440.2Net Current Assets 352.9 1,411.7 972.9 1,127.6 318.9 569.5Capital Employed 1,741.9 6,967.5 6,130.5 3,938.9 1,798.0 2,064.3Equity Share Capital # 23.8 95.0 93.3 83.5 59.9 67.5Share Warrants $ 94.4 377.4 — — — —Reserves & Surplus (Net of misc. expenditure not written off ) 887.8 3,551.3 3,031.2 2,124.1 1204.8 1,345.8Net Worth 1,005.9 4,023.7 3,124.5 2,207.6 1,264.7 1,413.3Long Term Loans 460.3 1,841.2 1,869.2 972.5 211.5 534.0Short Term Loans 225.6 902.2 962.7 591.1 194.3 117.0Total Loan Funds 685.9 2,743.4 2,831.8 1,563.6 405.8 651.1Deferred Tax 50.1 200.3 174.1 167.7 127.5 —Capital Employed 1,741.9 6,967.5 6,130.5 3,938.9 1,798.0 2,064.3#Capital raised through (a) conversion of 17 Lacs warrants in March 20<strong>08</strong> out of 2.05 Crores warrants issued to promoters in February 20<strong>08</strong>; (b) rightsissue in February <strong>2007</strong>; and (c) merger of Indo Gulf & <strong>Birla</strong> Global w.e.f. 1st September, 2005.$10% application money received on remaining 1.88 Crores warrants, each warrant to be convertible into one equity share @ Rs. 2,007.45 per share.RATIOS & STATISTICS Units <strong>2007</strong>-<strong>08</strong> 2006-07 2005-06 2003-04 1998-99Operating Margin % 15.1 16.4 15.9 15.4 18.3Gross Profit Margin % 11.6 12.6 14.7 15.4 15.9Net Profit Margin % 6.2 6.6 7.1 8.3 8.2Net Sales/Average Assets x 0.6 0.7 0.9 0.9 0.6Interest Cover (EBITDA/Gross Interest) x 3.1 3.1 6.5 10.7 2.3DSCR x 1.2 1.2 2.9 1.7 1.9ROACE (PBIT/Average Capital Employed) % 7.7 9.9 11.8 11.4 7.4ROAE (Net Profit/Average Net Worth) % 6.8 8.4 10.5 10.8 7.1Current Ratio x 3.0 3.1 3.3 2.3 3.0Debt Equity Ratio (Total Debt) x 0.7 0.9 0.7 0.3 0.5Debt Equity Ratio (Long Term Debt) x 0.5 0.6 0.4 0.2 0.4Dividend per Share Rs. 5.8 (14 Cents) 5.5 5.0 4.0 4.0Dividend (as % to Net Profit) % 26.3 26.0 25.5 20.6 28.3EPS (Weighted Average) Rs. 26.1 (65 Cents) 25.6 24.5 21.1 15.1CEPS (Weighted Average) Rs. 43.9 (USD 1.1) 41.0 38.2 35.2 28.1Book Value per Share Rs. 424 (USD 10.6) 335 264 212 209No. of Equity Shareholders Numbers 155,028 164,603 89,287 102,488 155,558Closing Market Price as on 31st March - NSE Rs. 1,396.2 (USD 34.9) 1,070.9 748.0 188.5 83.3Market Capitalisation - NSE Rs. Crores 13,265 (USD Mn 3,319) 9,992 6,246 1,128 562Price Earning Ratio (NSE) x 53.6 41.8 30.6 8.9 5.5Price/Book Value Ratio (NSE) x 3.3 3.2 2.8 0.9 0.4Exports (FOB) Rs. Crores 624.3 (USD Mn 156.2) 482.6 460.1 383.5 287.9Capital Expenditure (Net) Rs. Crores 224.8 (USD Mn 56.2) 293.9 199.9 147.6 88.7Strategic Investments (Net Additions) Rs. Crores 435.4 (USD Mn 1<strong>08</strong>.9) 2,063.6 791.9 165.8 85.41 USD = Rs. 39.97(9)