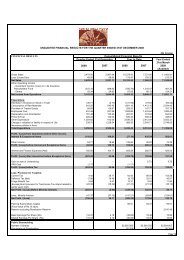
FINANCIAL HIGHLIGHTS - CONSOLIDATEDRs. CroresPROFIT & LOSS ACCOUNT <strong>2007</strong>-<strong>08</strong> 2006-07 2005-06 2003-04 2001-02*USD Million Rs. CroresNet Income From OperationsLife Insurance 1,003.8 4,012.1 2,068.8 1,398.8 545.3 27.7Telecom (w.e.f. 1st April, 2002) 534.3 2,135.6 1,421.8 388.3 55.6 —BPO (Acquired w.e.f. 1st July, 2003) 394.7 1,577.7 1,015.5 163.3 57.3 —Garments 256.7 1,025.8 830.4 620.6 391.7 381.6Carbon Black 216.1 863.8 738.9 564.2 340.3 322.8Fertilisers (Merged w.e.f. 1st September 2005) 191.4 765.0 778.5 379.4 — —Textiles (Spun Yarn & Fabrics) 148.8 594.9 625.0 527.7 397.9 328.5Rayon Yarn (Including Caustic & Allied Chemicals) 118.9 475.2 441.5 385.6 335.2 265.9Insulators 99.7 398.7 225.3 249.2 154.4 211.3Financial Services (Merged w.e.f. 1st September 2005) 49.4 197.5 137.5 71.0 — —Software (w.e.f. 24th October, 2001) 25.3 101.1 93.6 85.8 86.0 37.7Others — — — 1.0 47.7 54.4Inter business transfer (3.4) (13.4) (10.0) (4.5) (7.0) (12.0)Net Income From Operations 3,035.8 12,134.0 8,366.8 4830.3 2,404.2 1,617.8PBIT 144.2 576.3 716.8 390.8 77.3 75.3Interest and Finance expenses (Net) 106.3 425.0 363.3 103.8 32.4 48.7Profit before Exceptional Items and Tax 37.9 151.3 353.5 286.9 44.9 26.6Exceptional Gain/ (Loss) 0.2 0.7 0.5 (4.0) 17.3 1.3Provision for Taxation (Net) 31.5 125.9 111.9 94.1 49.3 32.1Net Profit Before Minority Interest 6.5 26.2 242.1 188.8 12.9 (4.1)Less : Minority Interest /share in (Profit) / Loss of associates (31.2) (124.6) (38.8) (15.3) (20.2) (14.2)Net Profit 37.7 150.8 280.9 204.1 33.1 10.0Rs. CroresBALANCE SHEET <strong>2007</strong>-<strong>08</strong> 2006-07 2005-06 2003-04 2001-02*USD Million Rs. CroresNet Fixed Assets 1,363.0 5,447.8 3,777.6 2,157.6 993.6 891.9Goodwill On Consolidation 643.2 2,571.0 2,594.9 961.3 153.8 81.1InvestmentsInsurance (Shareholder’s & Policyholders’ Investments) 1,724.5 6,892.7 4,020.0 2,554.8 644.1 28.6Others 118.7 474.3 523.3 362.1 232.2 306.6Total Investments 1,843.1 7,367.0 4,543.4 2,916.9 876.3 335.3Net Current Assets 551.9 2,206.0 1,750.2 1,017.6 339.3 427.2Capital Employed 4,401.3 17,591.9 12,666.1 7,053.4 2,363.1 1,735.5Equity Share Capital # 23.8 95.0 93.3 83.5 59.9 59.9Preference Share Capital 12.5 50.0 — 100.2 20.7 —Share Warrants $ 94.4 377.4 — — — —Reserves & Surplus (Net of misc. expenditure not written off ) 878.3 3,510.4 3,026.3 1,914.8 999.7 983.9Net Worth 1,009.0 4,032.9 3,119.6 2,098.5 1,<strong>08</strong>0.3 1,043.8Policyholders Fund 1,622.4 6,484.7 3,762.0 2,378.4 539.1 19.8Fund for future appropriation 6.5 25.9 0.03 0.03 0.03 —Secured fund 1,127.8 4,507.6 4,<strong>08</strong>0.0 1,525.2 551.2 498.7Unsecured fund 535.5 2,140.2 1,381.6 839.4 37.2 34.6Total Loan Funds 1,663.2 6,647.9 5,461.6 2,364.6 588.3 533.3Minority Interest 43.6 174.4 143.3 43.2 27.8 37.4Deferred Tax 56.6 226.2 179.6 168.7 127.6 101.2Capital Employed 4,401.3 17,591.9 12,666.1 7,053.4 2,363.1 1,735.5# Capital raised through (a) conversion of 17 Lacs warrants in March 20<strong>08</strong> out of 2.05 Crores warrants issued to promoters in February 20<strong>08</strong>; (b) rightsissue in February <strong>2007</strong> and (c) merger of Indo Gulf & <strong>Birla</strong> Global w.e.f. 1st September 2005$ 10% application money received on remaining 1.88 Crores warrants, each warrant to be convertible into one equity share @ Rs. <strong>2007</strong>.45 per shareRATIOS & STATISTICS Unit <strong>2007</strong>-<strong>08</strong> 2006-07 2005-06 2003-04 2001-02*Operating Margin % 9.1 13.6 12.7 8.5 10.0Net Margin % 1.2 3.4 4.2 1.4 0.6Net Sales / Average Assets x 0.8 0.8 0.9 1.2 0.9Debt Equity Ratio (Total Debt) x 1.6 1.8 1.1 0.5 0.5Interest Cover (EBITDA / Net Interest) x 2.6 3.1 5.9 6.3 3.3ROACE (PBIT / Average Capital Employed) % 5.9 10.8 12.2 4.8 4.3ROAE (Net Profit / Average Net Worth) % 4.2 10.8 12.7 3.1 0.9EPS (Weighted average) Rs. 16.0 (40 Cents) 32.0 26.1 5.3 1.61 USD = Rs. 39.97* The Company started reporting consolidated results from FY2001-02(10)
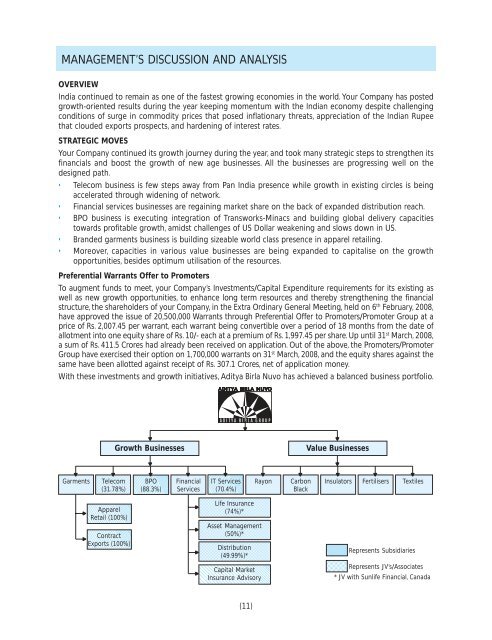
MANAGEMENT’S DISCUSSION AND ANALYSISOVERVIEWIndia continued to remain as one of the fastest growing economies in the world. Your Company has postedgrowth-oriented results during the year keeping momentum with the Indian economy despite challengingconditions of surge in commodity prices that posed inflationary threats, appreciation of the Indian Rupeethat clouded exports prospects, and hardening of interest rates.STRATEGIC MOVESYour Company continued its growth journey during the year, and took many strategic steps to strengthen itsfinancials and boost the growth of new age businesses. All the businesses are progressing well on thedesigned path.• Telecom business is few steps away from Pan India presence while growth in existing circles is beingaccelerated through widening of network.• Financial services businesses are regaining market share on the back of expanded distribution reach.• BPO business is executing integration of Transworks-Minacs and building global delivery capacitiestowards profitable growth, amidst challenges of US Dollar weakening and slows down in US.• Branded garments business is building sizeable world class presence in apparel retailing.• Moreover, capacities in various value businesses are being expanded to capitalise on the growthopportunities, besides optimum utilisation of the resources.Preferential Warrants Offer to PromotersTo augment funds to meet, your Company’s Investments/Capital Expenditure requirements for its existing aswell as new growth opportunities, to enhance long term resources and thereby strengthening the financialstructure, the shareholders of your Company, in the Extra Ordinary General Meeting, held on 6 th February, 20<strong>08</strong>,have approved the issue of 20,500,000 Warrants through Preferential Offer to Promoters/Promoter Group at aprice of Rs. 2,007.45 per warrant, each warrant being convertible over a period of 18 months from the date ofallotment into one equity share of Rs. 10/- each at a premium of Rs. 1,997.45 per share. Up until 31 st March, 20<strong>08</strong>,a sum of Rs. 411.5 Crores had already been received on application. Out of the above, the Promoters/PromoterGroup have exercised their option on 1,700,000 warrants on 31 st March, 20<strong>08</strong>, and the equity shares against thesame have been allotted against receipt of Rs. 307.1 Crores, net of application money.With these investments and growth initiatives, <strong>Aditya</strong> <strong>Birla</strong> <strong>Nuvo</strong> has achieved a balanced business portfolio.Growth BusinessesValue BusinessesGarmentsTelecom(31.78%)BPO(88.3%)FinancialServicesIT Services(70.4%)RayonCarbonBlackInsulators Fertilisers TextilesApparelRetail (100%)ContractExports (100%)Life Insurance(74%)*Asset Management(50%)*Distribution(49.99%)*Capital MarketInsurance AdvisoryRepresents SubsidiariesRepresents JV’s/Associates* JV with Sunlife Financial, Canada(11)