SCHEDULESSCHEDULE 19 (Contd.)SIGNIFICANT ACCOUNTING POLICIES AND NOTES ON ACCOUNTSANNEXURE - IIINFORMATION PURSUANT TO THE PROVISIONS OF PARAGRAPHS 3, 4C AND 4D OF PART II OF SCHEDULE VI OF THECOMPANIES ACT, 1956a) Details of Products Manufactured, Turnover, Opening Stock, Closing Stock, etc.Rs. CroresParticulars Installed Opening Stock** Production Purchase Turnover Closing StockYear Ended CapacityUnit 31st March Per Annum Quantity Amount Quantity Quantity Amount Quantity@ Amount Quantity AmountGarments Nos./000 20<strong>08</strong> 4,918 112.31 8,2<strong>08</strong>* 3,040 113.53 10,966 817.94 5,200 157.22Nos./000 <strong>2007</strong> 3,204 76.68 9,852* 2,571 70.39 10,709 693.65 4,918 112.31Viscose Filament MT 20<strong>08</strong> 16,400 1,571 22.28 17,000 — — 17,923 329.30 648 11.16Rayon Yarn MT <strong>2007</strong> 16,400 941 13.05 17,669 — — 17,039 3<strong>08</strong>.21 1,571 22.28Sulphuric Acid and Allied MT 20<strong>08</strong> 55,300 650 0.42 50,545 — — 49,859 26.66 1,336 0.96Chemicals MT <strong>2007</strong> 55,300 1,221 0.79 52,345 — — 52,916 16.52 650 0.42Caustic Soda MT 20<strong>08</strong> 82,125 859 0.65 74,468 — — 74,441 122.68 886 0.66MT <strong>2007</strong> 82,125 422 0.40 67,663 — — 67,226 111.15 859 0.66Chlorine MT 20<strong>08</strong> 73,000 298 0.04 62,302 — — 62,093 25.25 507 0.25MT <strong>2007</strong> 73,000 271 0.16 56,551 — — 56,524 25.98 298 0.04Hydro Chloric Acid MT 20<strong>08</strong> 11,115 64 0.01 11,<strong>08</strong>1 — — 10,786 1.60 359 0.07MT <strong>2007</strong> 11,115 102 0.02 8,594 — — 8,632 1.44 64 0.01Spun Yarn MT 20<strong>08</strong> 60,664 Spdl. 580 15.60 12,282 85 4.66 12,370 476.37 577 26.59MT <strong>2007</strong> 78,344 Spdl. 1,2<strong>08</strong> 20.74 17,720 9 0.27 18,357 513.57 580 15.60Cloth ’000 Mtrs. 20<strong>08</strong> 107 Looms 1,407 18.36 4,792 — — 4,710 98.61 1,489 21.94’000 Mtrs. <strong>2007</strong> 76 Looms 964 12.54 5,<strong>08</strong>8 — — 4,645 98.60 1,407 18.36Carbon Black MT 20<strong>08</strong> 230,000 4,476 17.37 215,103 — — 214,617 941.<strong>08</strong> 4,962 18.79MT <strong>2007</strong> 170,000 2,701 8.50 182,668 — — 180,893 817.66 4,476 17.37High and Low TensionInsulators MT 20<strong>08</strong> 38,800 1,561 8.00 32,921 248 0.80 32,304 410.70 2,426 18.54and Bushings*** MT <strong>2007</strong> — — — — 7,776 74.88 7,776 112.31 — —Lightning and Surge Nos. 20<strong>08</strong> 25,000 7,285 0.60 9,8<strong>08</strong> — — 9,117 18.11 7,976 0.23Arrestors Nos. <strong>2007</strong> — — — — 4,349 0.36 4,349 0.38 — —Liquid Argon ’000 SM 3 20<strong>08</strong> 3,000 73 0.26 1,284 — — 1,266 5.09 91 0.44’000 SM 3 <strong>2007</strong> 3,000 45 0.17 1,882 — — 1,854 8.53 73 0.26Urea MT 20<strong>08</strong> 2,620 per day 5,337 3.21 880,991 — — 870,305 695.09 16,023 11.07MT <strong>2007</strong> 2,620 per day 20,838 10.54 1,028,064 — — 1,043,565 756.74 5,337 3.21Traded Goods 20<strong>08</strong> — 1.69 — — 62.46 — 74.11 — 1.30<strong>2007</strong> — 0.96 — 16.02 — 16.92 — 1.59Financial Services 20<strong>08</strong> — — — — — — 5.27 — —<strong>2007</strong> — — — — — — 27.65 — —Others 20<strong>08</strong> — 2.94 — — 6.31 — 89.66 — 4.47<strong>2007</strong> — 2.98 — — 2.38 — 68.58 — 2.93Total 20<strong>08</strong> 203.74 187.76 — 4,137.52 — 273.69<strong>2007</strong> 147.53 164.32 — 3,577.89 — 195.04The Installed Capacity is as Certified by the Management, and licensed capacity is not given as licensing, has been abolished.@ Turnover quantity includes captive consumption, damages, sample sales and shortages, and value includes Export benefits.* Garment production includes items produced on job work basis by outside parties and purchases.** Includes Rs. 8.70 Crores (P.Y.: Nil) of inventories acquired on amalagamation.*** Includes commission of Nil (P.Y. : Rs. 26.03 Crores).(116)
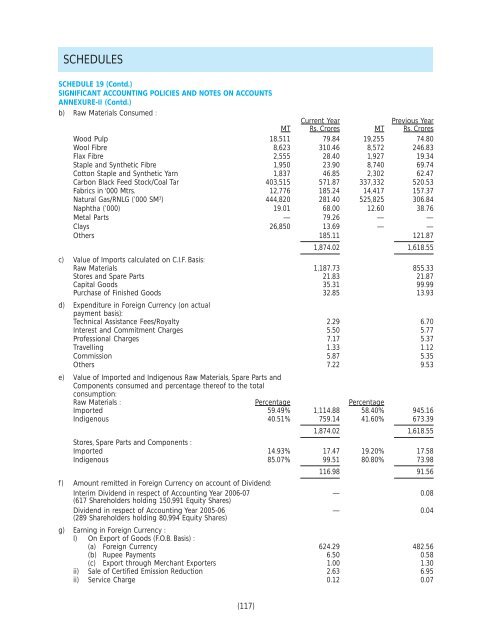
SCHEDULESSCHEDULE 19 (Contd.)SIGNIFICANT ACCOUNTING POLICIES AND NOTES ON ACCOUNTSANNEXURE-II (Contd.)b) Raw Materials Consumed :Current YearPrevious YearMT Rs. Crores MT Rs. CroresWood Pulp 18,511 79.84 19,255 74.80Wool Fibre 8,623 310.46 8,572 246.83Flax Fibre 2,555 28.40 1,927 19.34Staple and Synthetic Fibre 1,950 23.90 8,740 69.74Cotton Staple and Synthetic Yarn 1,837 46.85 2,302 62.47Carbon Black Feed Stock/Coal Tar 403,515 571.87 337,332 520.53Fabrics in ‘000 Mtrs. 12,776 185.24 14,417 157.37Natural Gas/RNLG (’000 SM 3 ) 444,820 281.40 525,825 306.84Naphtha (’000) 19.01 68.00 12.60 38.76Metal Parts — 79.26 — —Clays 26,850 13.69 — —Others 185.11 121.871,874.02 1,618.55c) Value of Imports calculated on C.I.F. Basis:Raw Materials 1,187.73 855.33Stores and Spare Parts 21.83 21.87Capital Goods 35.31 99.99Purchase of Finished Goods 32.85 13.93d) Expenditure in Foreign Currency (on actualpayment basis):Technical Assistance Fees/Royalty 2.29 6.70Interest and Commitment Charges 5.50 5.77Professional Charges 7.17 5.37Travelling 1.33 1.12Commission 5.87 5.35Others 7.22 9.53e) Value of Imported and Indigenous Raw Materials, Spare Parts andComponents consumed and percentage thereof to the totalconsumption:Raw Materials : Percentage PercentageImported 59.49% 1,114.88 58.40% 945.16Indigenous 40.51% 759.14 41.60% 673.391,874.02 1,618.55Stores, Spare Parts and Components :Imported 14.93% 17.47 19.20% 17.58Indigenous 85.07% 99.51 80.80% 73.98116.98 91.56f) Amount remitted in Foreign Currency on account of Dividend:Interim Dividend in respect of Accounting Year 2006-07 — 0.<strong>08</strong>(617 Shareholders holding 150,991 Equity Shares)Dividend in respect of Accounting Year 2005-06 — 0.04(289 Shareholders holding 80,994 Equity Shares)g) Earning in Foreign Currency :I) On Export of Goods (F.O.B. Basis) :(a) Foreign Currency 624.29 482.56(b) Rupee Payments 6.50 0.58(c) Export through Merchant Exporters 1.00 1.30ii) Sale of Certified Emission Reduction 2.63 6.95ii) Service Charge 0.12 0.07(117)