Verkley et al.and multi-gene sequence analyses of the sep<strong>to</strong>ria-like generabased on numerous isolates (<strong>in</strong>clud<strong>in</strong>g S. cytisi). In their study, theyresolve the aff<strong>in</strong>ities and settle the nomenclature of all importantsep<strong>to</strong>ria-like genera <strong>in</strong> the Dothideales and Pleosporales.Host specificity has long been a decisive criterium <strong>in</strong> <strong>species</strong><strong>delimitation</strong> <strong>in</strong> Sep<strong>to</strong>ria, ma<strong>in</strong>ly because of the paucity of usefulmorphological characters and the high level of variation there<strong>in</strong>.Traditionally, <strong>species</strong> of Sep<strong>to</strong>ria that were morphologically verysimilar but found on plants of different host families, were regardedas dist<strong>in</strong>ct taxa. Material from the same genus or from closely relatedhost genera from the same plant family that could be dist<strong>in</strong>guishedby features such as conidial length and/or width and septationwere usually also considered <strong>to</strong> belong <strong>to</strong> separate <strong>species</strong>.Most taxonomists revis<strong>in</strong>g Sep<strong>to</strong>ria lacked facilities <strong>to</strong> thoroughly<strong>in</strong>vestigate host ranges. A number of economically importantSep<strong>to</strong>ria <strong>species</strong> and <strong>species</strong> complexes have been subjected <strong>to</strong><strong>in</strong>fection experiments on various hosts, viz. the pathogens of Apium(Cochran 1932, Sheridan 1968) and cultivated Chrysanthemum(Waddell & Weber 1963, Punithal<strong>in</strong>gam & Wheeler 1965). Theresults of these studies largely seemed <strong>to</strong> confirm the general beliefthat Sep<strong>to</strong>ria <strong>species</strong> have host ranges that are limited <strong>to</strong> a s<strong>in</strong>glegenus of plants and <strong>in</strong> relatively few cases, also <strong>in</strong>clude a few closelyrelated genera from the same plant family (Priest 2006). Molecularphylogenetic studies on Sep<strong>to</strong>ria <strong>species</strong> <strong>in</strong>fect<strong>in</strong>g Asteraceae(Verkley & Star<strong>in</strong>k-Willemse 2004) and woody perennials (Feau etal. 2006) showed that <strong>species</strong> that are capable of <strong>in</strong>fect<strong>in</strong>g hostsof the same plant family do not (always) cluster <strong>in</strong> monophyleticgroups, which is <strong>in</strong>dicative of disjunct evolutionary patterns of thesepathogens and their hosts. To expla<strong>in</strong> these patterns, it has beenpostulated that “host jump<strong>in</strong>g” occurs from typical (susceptible)hosts <strong>to</strong> “non-host” plants through asymp<strong>to</strong>matic tissue <strong>in</strong>fectionand subsequent exploration of <strong>new</strong> susceptible hosts. Examplesof this were found <strong>in</strong> certa<strong>in</strong> Mycosphaerella <strong>species</strong> and theirAcacia hosts (Crous et al. 2004b, Crous & Groe<strong>new</strong>ald 2005), butthe mechanisms driv<strong>in</strong>g host jump<strong>in</strong>g are not yet unders<strong>to</strong>od. Withour study <strong>in</strong> which we <strong>in</strong>vestigate the phylogenetic relationships of<strong>species</strong> from a wider spectrum of host families we hope <strong>to</strong> providemore <strong>in</strong>sight <strong>in</strong><strong>to</strong> the evolution of these fungal pathogens and theirhost plants and <strong>to</strong> contribute <strong>to</strong> understand<strong>in</strong>g such mechanisms.Early molecular phylogenetic studies have confirmed therelationships of sep<strong>to</strong>ria-like fungi with sexual morphs with<strong>in</strong>Mycosphaerellaceae, and that the sep<strong>to</strong>ria-like fungi are of poly- andparaphyletic orig<strong>in</strong>s (Stewart et al. 1999, Crous et al. 2001, Goodw<strong>in</strong>et al. 2001, Verkley et al. 2004a, b, Verkley & Star<strong>in</strong>k-Willemse, 2004).The ITS and/or LSU nrDNA sequence data used <strong>in</strong> those studiesdid not provide sufficient phylogenetic <strong>in</strong>formation <strong>to</strong> discrim<strong>in</strong>ateclosely related <strong>species</strong> nor resolve most of the <strong>in</strong>ternal nodes <strong>in</strong> thetrees. Verkley et al. (2004a, b) already concluded that groups with<strong>in</strong>the then known “Mycosphaerella clade” showed no correlation <strong>to</strong>conidiomatal structure or conidiogenesis, confirm<strong>in</strong>g the conclusionsdrawn by Crous et al. (2001). Feau et al. (2006) sequenced the ITS,partial β-tubul<strong>in</strong> gene, and a proportion of the mi<strong>to</strong>chondrial smallsubunit ribosomal gene (mtSSU) <strong>to</strong> <strong>in</strong>fer a phylogeny for Sep<strong>to</strong>riaassociated with diseases of woody perennials (many of whichare here transferred <strong>to</strong> Sphaerul<strong>in</strong>a). Although their <strong>in</strong>ferred treesprovided improved resolution, it was clear that even more DNA lociwould be needed <strong>to</strong> fully resolve closely related <strong>species</strong> and <strong>species</strong>complexes with<strong>in</strong> Sep<strong>to</strong>ria s. str.The primary goal of our work was <strong>to</strong> improve the taxonomy ofSep<strong>to</strong>ria by adopt<strong>in</strong>g a polyphasic <strong>approach</strong> <strong>to</strong> taxon <strong>delimitation</strong>.To this end we studied cultures preserved <strong>in</strong> <strong>CBS</strong>, Utrecht, theNetherlands and material freshly collected <strong>in</strong> the field, did a fullcharacterisation of the morphology <strong>in</strong> planta and <strong>in</strong> vitro, andsequenced seven DNA loci, viz. nuclear ITS and (partial) LSUribosomal RNA genes, and RPB2, act<strong>in</strong> (Act), calmodul<strong>in</strong> (Cal),β-tubul<strong>in</strong> (Btub), and translation elongation fac<strong>to</strong>r 1-alpha (EF)genes. The obta<strong>in</strong>ed datasets of the seven loci were also evaluatedfor PCR amplification success rates and barcode gaps <strong>in</strong> order <strong>to</strong>determ<strong>in</strong>e which <strong>in</strong>dividual, or comb<strong>in</strong>ation of loci, would be bestsuited for fast and reliable <strong>species</strong> resolution and identification.Most students of Sep<strong>to</strong>ria have focused on material on the naturalsubstrate and did not isolate and deposit cultures <strong>in</strong> public culturecollections. Of all material we were able <strong>to</strong> successfully isolate,cultures were deposited <strong>in</strong> <strong>CBS</strong>-<strong>KNAW</strong> Fungal Biodiversity Centre(<strong>CBS</strong>) <strong>in</strong> Utrecht, The Netherlands. To assess the nomenclaturethis material was compared <strong>to</strong> type material as far as it could beobta<strong>in</strong>ed for study. Where useful <strong>new</strong> material and associated purecultures were designated as epitypes, <strong>to</strong> facilitate future work. Thisstudy supplements the work of Quaedvlieg et al. (2013), who atta<strong>in</strong>a broader perspective and address the complicated taxonomy andpolyphyly of sep<strong>to</strong>ria-like fungi, propos<strong>in</strong>g several <strong>new</strong> genera fortaxa that are distantly related <strong>to</strong> Sep<strong>to</strong>ria cytisi and allied <strong>species</strong>.MATERIAL AND METHODSCollect<strong>in</strong>g, isolat<strong>in</strong>g and morphological comparisonInfected plant material was collected <strong>in</strong> the field and taken<strong>to</strong> the labora<strong>to</strong>ry. Leaves were exam<strong>in</strong>ed directly under astereomicroscope <strong>to</strong> observe sporulat<strong>in</strong>g structures, or when<strong>in</strong>sufficiently developed, <strong>in</strong>cubated <strong>in</strong> a Petri-dish with wetted filterpaper for 1–2 d <strong>to</strong> enhance the development of fruit<strong>in</strong>g bodies.Cirrhi of spores were removed and mounted <strong>in</strong> tapwater for themicroscopic exam<strong>in</strong>ation of conidia. Isolates were obta<strong>in</strong>ed byeither transferr<strong>in</strong>g cirrhi directly on<strong>to</strong> 3 % malt extract agar (MEA,Oxoid) plates with 50 ppm penicill<strong>in</strong> and strep<strong>to</strong>myc<strong>in</strong>, and streakedover the agar surface with an <strong>in</strong>oculation loop and some sterilewater. Sometimes conidia <strong>in</strong> water from slide preparations weretaken with a loop and streaked directly on<strong>to</strong> a plate. After 1–3 dat room temperature, germ<strong>in</strong>ated conidia were transferred on <strong>to</strong>fresh media without antibiotics. New isolates were deposited <strong>in</strong> the<strong>CBS</strong>. Cultures taken from the <strong>CBS</strong> Collection were activated fromlyophilised or cryopreserved material and <strong>in</strong>oculated on oatmeal(OA) and MEA plates. A complete overview of the material used <strong>in</strong>this study is presented <strong>in</strong> Table 1.For the morphological study <strong>in</strong> planta hand sections weremade from <strong>in</strong>fected leaves, mounted <strong>in</strong> water and exam<strong>in</strong>edunder an Olympus BX 50 microscope equipped with brightfield and differential <strong>in</strong>terference contrast (DIC) objectives, andpho<strong>to</strong>graphed us<strong>in</strong>g a mounted Nikon Digital Sight DS-5M camera.Conidial masses were mounted <strong>in</strong> water and 30 spores measured.For culture studies, 7–14-d-old cultures were transferred <strong>to</strong> freshOA, MEA and cherry decoction agar (CHA) plates and placed <strong>in</strong> an<strong>in</strong>cuba<strong>to</strong>r under n-UV light (12 h light, 12 h dark) at 15 ºC <strong>to</strong> promotesporulation (if otherwise, this is <strong>in</strong>dicated <strong>in</strong> the descriptions). Mediawere prepared accord<strong>in</strong>g <strong>to</strong> Crous et al. (2009). Colony colourswere described accord<strong>in</strong>g <strong>to</strong> Rayner (1970). Sporulat<strong>in</strong>g structuresobta<strong>in</strong>ed from cultures were used for the morphological description<strong>in</strong> vitro. Pho<strong>to</strong>graphs of culture plates were taken after 2–3 wkon a pho<strong>to</strong> stand with daylight tubes with a Pentax K110 D digitalcamera. Cultures were <strong>in</strong>cubated up <strong>to</strong> 40 d <strong>to</strong> observe sporulationand other features.214
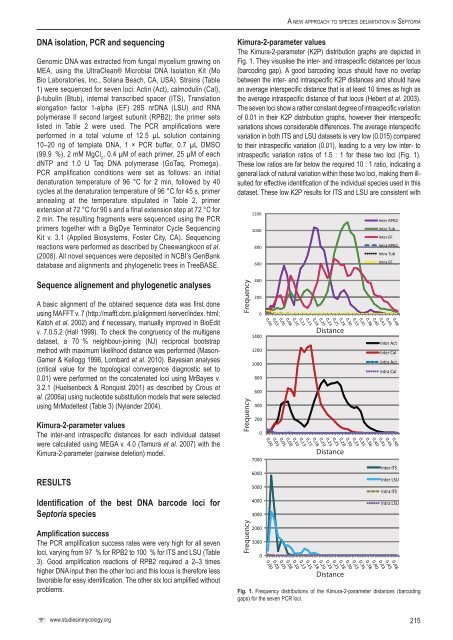
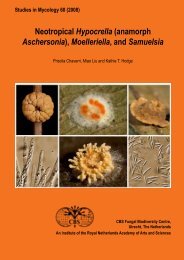
A <strong>new</strong> <strong>approach</strong> <strong>to</strong> <strong>species</strong> <strong>delimitation</strong> <strong>in</strong> Sep<strong>to</strong>riaDNA isolation, PCR and sequenc<strong>in</strong>gGenomic DNA was extracted from fungal mycelium grow<strong>in</strong>g onMEA, us<strong>in</strong>g the UltraClean® Microbial DNA Isolation Kit (MoBio Labora<strong>to</strong>ries, Inc., Solana Beach, CA, USA). Stra<strong>in</strong>s (Table1) were sequenced for seven loci: Act<strong>in</strong> (Act), calmodul<strong>in</strong> (Cal),β-tubul<strong>in</strong> (Btub), <strong>in</strong>ternal transcribed spacer (ITS), Translationelongation fac<strong>to</strong>r 1-alpha (EF) 28S nrDNA (LSU) and RNApolymerase II second largest subunit (RPB2); the primer setslisted <strong>in</strong> Table 2 were used. The PCR amplifications wereperformed <strong>in</strong> a <strong>to</strong>tal volume of 12.5 µL solution conta<strong>in</strong><strong>in</strong>g10–20 ng of template DNA, 1 × PCR buffer, 0.7 µL DMSO(99.9 %), 2 mM MgCl 2, 0.4 µM of each primer, 25 µM of eachdNTP and 1.0 U Taq DNA polymerase (GoTaq, Promega).PCR amplification conditions were set as follows: an <strong>in</strong>itialdenaturation temperature of 96 °C for 2 m<strong>in</strong>, followed by 40cycles at the denaturation temperature of 96 °C for 45 s, primeranneal<strong>in</strong>g at the temperature stipulated <strong>in</strong> Table 2, primerextension at 72 °C for 90 s and a f<strong>in</strong>al extension step at 72 °C for2 m<strong>in</strong>. The result<strong>in</strong>g fragments were sequenced us<strong>in</strong>g the PCRprimers <strong>to</strong>gether with a BigDye Term<strong>in</strong>a<strong>to</strong>r Cycle Sequenc<strong>in</strong>gKit v. 3.1 (Applied Biosystems, Foster City, CA). Sequenc<strong>in</strong>greactions were performed as described by Cheewangkoon et al.(2008). All novel sequences were deposited <strong>in</strong> NCBI’s GenBankdatabase and alignments and phylogenetic trees <strong>in</strong> TreeBASE.Sequence alignement and phylogenetic analysesA basic alignment of the obta<strong>in</strong>ed sequence data was first doneus<strong>in</strong>g MAFFT v. 7 (http://mafft.cbrc.jp/alignment /server/<strong>in</strong>dex. html;Ka<strong>to</strong>h et al. 2002) and if necessary, manually improved <strong>in</strong> BioEditv. 7.0.5.2 (Hall 1999). To check the congruency of the multigenedataset, a 70 % neighbour-jo<strong>in</strong><strong>in</strong>g (NJ) reciprocal bootstrapmethod with maximum likelihood distance was performed (Mason-Gamer & Kellogg 1996, Lombard et al. 2010). Bayesian analyses(critical value for the <strong>to</strong>pological convergence diagnostic set <strong>to</strong>0.01) were performed on the concatenated loci us<strong>in</strong>g MrBayes v.3.2.1 (Huelsenbeck & Ronquist 2001) as described by Crous etal. (2006a) us<strong>in</strong>g nucleotide substitution models that were selectedus<strong>in</strong>g MrModeltest (Table 3) (Nylander 2004).Kimura-2-parameter valuesThe <strong>in</strong>ter-and <strong>in</strong>traspecific distances for each <strong>in</strong>dividual datasetwere calculated us<strong>in</strong>g MEGA v. 4.0 (Tamura et al. 2007) with theKimura-2-parameter (pairwise deletion) model.RESULTSIdentification of the best DNA barcode loci forSep<strong>to</strong>ria <strong>species</strong>Amplification successThe PCR amplification success rates were very high for all sevenloci, vary<strong>in</strong>g from 97 % for RPB2 <strong>to</strong> 100 % for ITS and LSU (Table3). Good amplification reactions of RPB2 required a 2–3 timeshigher DNA <strong>in</strong>put then the other loci and this locus is therefore lessfavorable for easy identification. The other six loci amplified withoutproblems.Kimura-2-parameter valuesThe Kimura-2-parameter (K2P) distribution graphs are depicted <strong>in</strong>Fig. 1. They visualise the <strong>in</strong>ter- and <strong>in</strong>traspecific distances per locus(barcod<strong>in</strong>g gap). A good barcod<strong>in</strong>g locus should have no overlapbetween the <strong>in</strong>ter- and <strong>in</strong>traspecific K2P distances and should havean average <strong>in</strong>terspecific distance that is at least 10 times as high asthe average <strong>in</strong>traspecific distance of that locus (Hebert et al. 2003).The seven loci show a rather constant degree of <strong>in</strong>traspecific variationof 0.01 <strong>in</strong> their K2P distribution graphs, however their <strong>in</strong>terspecificvariations shows considerable differences. The average <strong>in</strong>terspecificvariation <strong>in</strong> both ITS and LSU datasets is very low (0.015) compared<strong>to</strong> their <strong>in</strong>traspecific variation (0.01), lead<strong>in</strong>g <strong>to</strong> a very low <strong>in</strong>ter- <strong>to</strong><strong>in</strong>traspecific variation ratios of 1.5 : 1 for these two loci (Fig. 1).These low ratios are far below the required 10 : 1 ratio, <strong>in</strong>dicat<strong>in</strong>g ageneral lack of natural variation with<strong>in</strong> these two loci, mak<strong>in</strong>g them illsuitedfor effective identification of the <strong>in</strong>dividual <strong>species</strong> used <strong>in</strong> thisdataset. These low K2P results for ITS and LSU are consistent withFrequencyFrequencyFrequency120010008006004002000140012001000800600400200070006000500040003000200010000DistanceDistanceDistanceInter RPB2Inter TubInter EFIntra RPB2Intra TubIntra EFInter ActInter CalIntra ActIntra CalInter ITSInter LSUIntra ITSIntra LSUFig. 1. Frequency distributions of the Kimura-2-parameter distances (barcod<strong>in</strong>ggaps) for the seven PCR loci.www.studies<strong>in</strong>mycology.org215