- Page 1: Fishery Ecosystem Plan for the Hawa
- Page 4 and 5: successful management of marine eco
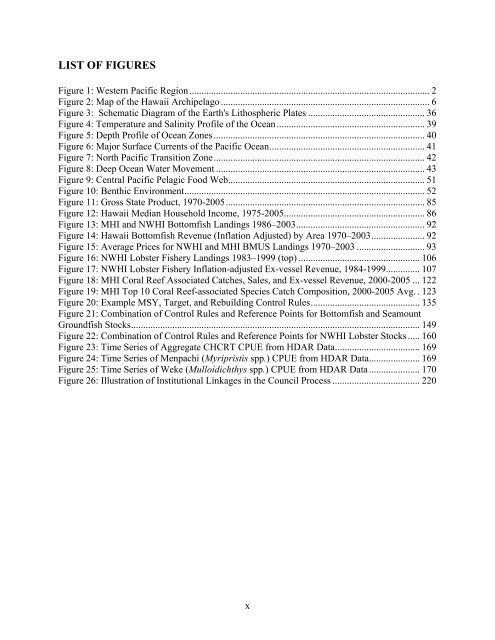
- Page 6 and 7: TABLE OF CONTENTSEXECUTIVE SUMMARY
- Page 10 and 11: 8.2.4 Fishery Data Requirements....
- Page 14 and 15: FRFA: Final Regulatory Flexibility
- Page 16 and 17: DEFINITIONSAdaptive Management: A p
- Page 18 and 19: Fishery: One or more stocks of fish
- Page 20 and 21: Pacific Remote Island Areas (PRIA):
- Page 22 and 23: CHAPTER 1: INTRODUCTION1.1 Introduc
- Page 24 and 25: The EPAP (1999) reached consensus t
- Page 26 and 27: EPAP’s 1999 report to Congress re
- Page 28 and 29: Objective 7: To promote the safety
- Page 30 and 31: Scientific Name English Common Name
- Page 32 and 33: Family Name Scientific Name English
- Page 34 and 35: Family Name Scientific Name English
- Page 36 and 37: Family Name Scientific Name English
- Page 38 and 39: Scientific Name English Common Name
- Page 40 and 41: as two additional members (fisherme
- Page 42 and 43: 1.7.2 Community Groups and Projects
- Page 44 and 45: 2. Ke kahea (proper introduction or
- Page 46 and 47: CHAPTER 2: TOPICS IN ECOSYSTEM APPR
- Page 48 and 49: ensuring long-term sustainability b
- Page 50 and 51: ecosystem in order to implement eff
- Page 52 and 53: issues. One alternative would be to
- Page 54 and 55: The community program of the Counci
- Page 56 and 57: denser than the continental portion
- Page 58 and 59: hydrogen sides and a negative charg
- Page 60 and 61: Figure 5: Depth Profile of Ocean Zo
- Page 62 and 63:
southern boundary of the Subartic F
- Page 64 and 65:
Near the equator, intense solar hea
- Page 66 and 67:
The Caroline Islands (~850 square m
- Page 68 and 69:
(~436 square miles) and Savai`i (~6
- Page 70 and 71:
and include fish, mollusks, crustac
- Page 72 and 73:
Figure 10: Benthic EnvironmentSourc
- Page 74 and 75:
eefs are often too slow to keep up
- Page 76 and 77:
factors, control coral reef communi
- Page 78 and 79:
Kauai: Kauai is the oldest and wett
- Page 80 and 81:
A major portion of the primary prod
- Page 82 and 83:
parts of banks may be composed of r
- Page 84 and 85:
size of the reef area surveyed, bas
- Page 86 and 87:
The families of bottomfish and seam
- Page 88 and 89:
the mesopelagic community migration
- Page 90 and 91:
Physical and biological oceanograph
- Page 92 and 93:
Migratory routes of leatherback tur
- Page 94 and 95:
seem to have a more carnivorous die
- Page 96 and 97:
turtles outnumber adults 100:1. The
- Page 98 and 99:
Humpback whales migrate through wat
- Page 100 and 101:
The 2004 U.S. Pacific Marine Mammal
- Page 102 and 103:
Historically, the short-tailed alba
- Page 104 and 105:
Table 9: Hawaii’s “Export” In
- Page 106 and 107:
Cost of Living Analysis: Ratio of H
- Page 108 and 109:
annual fishery ex-vessel revenues o
- Page 110 and 111:
State catch reports reporting their
- Page 112 and 113:
1200(1000 lbs)100080060040020001986
- Page 114 and 115:
sources have been used to assess by
- Page 116 and 117:
Protected Species InteractionsThe 1
- Page 118 and 119:
• Killer whale (Orcinus orca)•
- Page 120 and 121:
levels for all fisheries, and a pro
- Page 122 and 123:
annually) to meet the FMP’s overf
- Page 124:
4.2.4 Bottomfish MSYA 2009 report b
- Page 128 and 129:
is not recorded by NMFS, dockside r
- Page 130 and 131:
percentage of the total catch if me
- Page 132 and 133:
4.3.3 Status of Crustaceans Fishery
- Page 134 and 135:
maneuverable tools to harvest indiv
- Page 136 and 137:
• Dall’s porpoise (Phocoenoides
- Page 138 and 139:
MSYs for the Makapuu Established Be
- Page 140 and 141:
3. A moratorium on gold coral harve
- Page 142 and 143:
2,000,000$2,500,0001,800,0001,600,0
- Page 144 and 145:
estrictions for sale or for capture
- Page 146 and 147:
Seine nets are actively deployed ar
- Page 148 and 149:
4.5.3 Status of Coral Reef Fisherie
- Page 150 and 151:
commercial harvests of the “red f
- Page 152 and 153:
commercial catches and to count the
- Page 154 and 155:
The National Standard Guidelines fo
- Page 156 and 157:
Source: Restrepo et al. 1998In Figu
- Page 158 and 159:
from having fallen below MSST. In t
- Page 160 and 161:
vessel that landed at least 6,000lb
- Page 162 and 163:
By June 30 of each year, a Council-
- Page 164 and 165:
In addition to the thresholds MFMT
- Page 166 and 167:
The best information available is u
- Page 168 and 169:
More recently, PIFSC published a st
- Page 170 and 171:
The fishery management area for the
- Page 172 and 173:
Hawaii. In addition, the holder of
- Page 174 and 175:
5.4.6 Closed SeasonsLobster fishing
- Page 176 and 177:
was related to the lobster fishery,
- Page 178 and 179:
ecommendation of Restrepo et al. (1
- Page 180 and 181:
Figure 22: Combination of Control R
- Page 182 and 183:
cm) from the top surface of the liv
- Page 184 and 185:
Table 25: Estimates of MSY of Preci
- Page 186 and 187:
5.6.2 NotificationAny special permi
- Page 188 and 189:
Clearly, any given species that is
- Page 190 and 191:
Weke CPUE120100Pounds per record806
- Page 192 and 193:
1948-1952 aggregate 1995-1999 aggre
- Page 194 and 195:
CHAPTER 6: IDENTIFICATION AND DESCR
- Page 196 and 197:
eviewing and refining EFH designati
- Page 198 and 199:
The eggs and larvae of all BMUS are
- Page 200 and 201:
juvenile and adult spiny lobster is
- Page 202 and 203:
Instead, the Council designated the
- Page 204 and 205:
Species Ma La Es SB Ss Cr/Hs Pr Sz
- Page 206 and 207:
Species Ma La Es SB Ss Cr/Hs Pr Sz
- Page 208 and 209:
Table 30: Occurrence of Currently H
- Page 210 and 211:
Table 31: Summary of EFH Designatio
- Page 212 and 213:
Species Assemblage/Complex EFH (Egg
- Page 214 and 215:
MUS/Taxa Ma La Es SB Ss Cr/Hs Pr DS
- Page 216 and 217:
MUS/Taxa Ma La Es SB Ss Cr/Hs Pr DS
- Page 218 and 219:
The relatively long pelagic larval
- Page 220 and 221:
BottomfishandSeamountGroundfishSpec
- Page 222 and 223:
Table 35: Coral Reef Ecosystem HAPC
- Page 224 and 225:
necessary at this time. However, th
- Page 226 and 227:
Table 36: Threats to Coral Reefs in
- Page 228 and 229:
• Biological availability of toxi
- Page 230 and 231:
9. The best land management practic
- Page 232 and 233:
maximum extent possible. Sampling d
- Page 234 and 235:
Coral Reef Ecosystem Species• The
- Page 236 and 237:
SubsistencerepresentativesEcosystem
- Page 238 and 239:
island society. Rapid changes in th
- Page 240 and 241:
The Council is serving as a role mo
- Page 242 and 243:
CHAPTER 8: CONSISTENCY WITH APPLICA
- Page 244 and 245:
Table 38: Bycatch Reporting Methodo
- Page 246 and 247:
The measures in this FEP are consis
- Page 248 and 249:
MUSEFH(Juveniles and Adults)EFH(Egg
- Page 250 and 251:
The management and conservation mea
- Page 252 and 253:
deterrence provisions set forth in
- Page 254 and 255:
conservation measures to proceed. I
- Page 256 and 257:
CHAPTER 9: STATE, LOCAL AND OTHER F
- Page 258 and 259:
when on June 15, 2006, President Ge
- Page 260 and 261:
CHAPTER 10: PROPOSED REGULATIONSIn
- Page 262 and 263:
Symp. on Sea Turtle Biology and Con
- Page 264 and 265:
Cliffton K., D. Cornejo, R., and Fe
- Page 266 and 267:
Druffel, E. R. M., Griffin, S., Wit
- Page 268 and 269:
Pacific. In K. Bjorndal, ed. Biolog
- Page 270 and 271:
Hodge, R. and B. Wing. 2000. Occurr
- Page 272 and 273:
Khang S.E. and R.Grigg. 2005. Impac
- Page 274 and 275:
turtle species known to date. FAO s
- Page 276 and 277:
NMFS (National Marine Fisheries Ser
- Page 278 and 279:
Resources of the South Pacific: Inf
- Page 280 and 281:
Reina, R .D., P. A. Mayor, J. R. Sp
- Page 282 and 283:
Smith, S.V. 1978. Coral-reef area a
- Page 284 and 285:
Wakeford, R. 2005. Personal Communi
- Page 286:
Wilson, R.R., and R.S. Kaufman. 198


