COUNTRY BACKGROUND - Gross National Happiness Commission
COUNTRY BACKGROUND - Gross National Happiness Commission
COUNTRY BACKGROUND - Gross National Happiness Commission

Create successful ePaper yourself
Turn your PDF publications into a flip-book with our unique Google optimized e-Paper software.
Economic Performance<br />
development was generally faster in Southern and Western Bhutan than in the East.<br />
III. Economic Development during the 1980sIII. Economic Development during the 1980s<br />
Availability of DataAvailability of Data<br />
2.6 The availability of economic data in Bhutan is variable. Consistent GDP series begin only in 1980, and the<br />
most recent year for which GDP estimates were available when the Plan was prepared, was 1989. This means that<br />
broad economic data were available only for the first half of 6FYP, although figures relating to public finance and<br />
foreign exchange were available for the whole period. Other areas where statistics are especially weak include<br />
employment and labour force data, trade, and production in the traditional sector (which accounts for almost half of<br />
all production).<br />
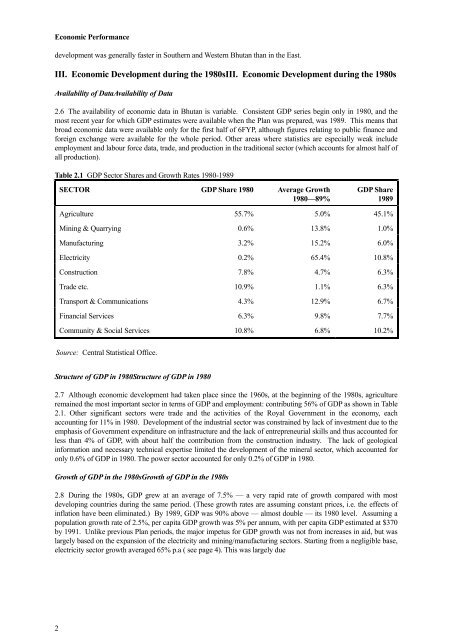
Table 2.1 GDP Sector Shares and Growth Rates 1980-1989<br />
Structure of GDP in 1980Structure of GDP in 1980<br />
2.7 Although economic development had taken place since the 1960s, at the beginning of the 1980s, agriculture<br />
remained the most important sector in terms of GDP and employment: contributing 56% of GDP as shown in Table<br />
2.1. Other significant sectors were trade and the activities of the Royal Government in the economy, each<br />
accounting for 11% in 1980. Development of the industrial sector was constrained by lack of investment due to the<br />
emphasis of Government expenditure on infrastructure and the lack of entrepreneurial skills and thus accounted for<br />
less than 4% of GDP, with about half the contribution from the construction industry. The lack of geological<br />
information and necessary technical expertise limited the development of the mineral sector, which accounted for<br />
only 0.6% of GDP in 1980. The power sector accounted for only 0.2% of GDP in 1980.<br />
Growth of GDP in the 1980sGrowth of GDP in the 1980s<br />
2.8 During the 1980s, GDP grew at an average of 7.5% — a very rapid rate of growth compared with most<br />
developing countries during the same period. (These growth rates are assuming constant prices, i.e. the effects of<br />
inflation have been eliminated.) By 1989, GDP was 90% above — almost double — its 1980 level. Assuming a<br />
population growth rate of 2.5%, per capita GDP growth was 5% per annum, with per capita GDP estimated at $370<br />
by 1991. Unlike previous Plan periods, the major impetus for GDP growth was not from increases in aid, but was<br />
largely based on the expansion of the electricity and mining/manufacturing sectors. Starting from a negligible base,<br />
electricity sector growth averaged 65% p.a ( see page 4). This was largely due<br />
2<br />
SECTOR GDP Share 1980 Average Growth<br />
1980—89%<br />
GDP Share<br />
1989<br />
Agriculture 55.7% 5.0% 45.1%<br />
Mining & Quarrying 0.6% 13.8% 1.0%<br />
Manufacturing 3.2% 15.2% 6.0%<br />
Electricity 0.2% 65.4% 10.8%<br />
Construction 7.8% 4.7% 6.3%<br />
Trade etc. 10.9% 1.1% 6.3%<br />
Transport & Communications 4.3% 12.9% 6.7%<br />
Financial Services 6.3% 9.8% 7.7%<br />
Community & Social Services 10.8% 6.8% 10.2%<br />
Source: Central Statistical Office.