COUNTRY BACKGROUND - Gross National Happiness Commission
COUNTRY BACKGROUND - Gross National Happiness Commission
COUNTRY BACKGROUND - Gross National Happiness Commission

You also want an ePaper? Increase the reach of your titles
YUMPU automatically turns print PDFs into web optimized ePapers that Google loves.
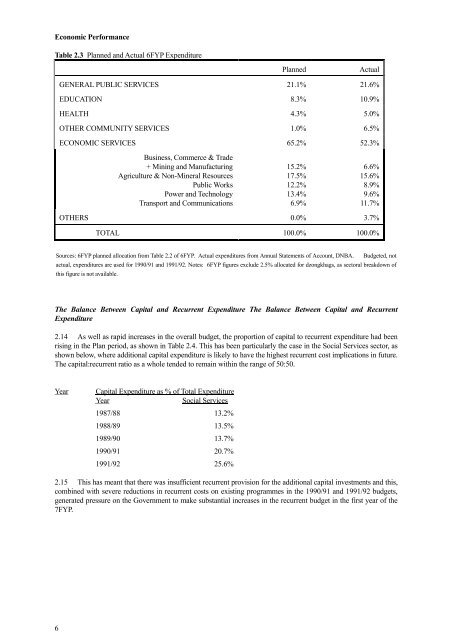
Economic Performance<br />
Table 2.3 Planned and Actual 6FYP Expenditure<br />
The Balance Between Capital and Recurrent Expenditure The Balance Between Capital and Recurrent<br />
Expenditure<br />
2.14 As well as rapid increases in the overall budget, the proportion of capital to recurrent expenditure had been<br />
rising in the Plan period, as shown in Table 2.4. This has been particularly the case in the Social Services sector, as<br />
shown below, where additional capital expenditure is likely to have the highest recurrent cost implications in future.<br />
The capital:recurrent ratio as a whole tended to remain within the range of 50:50.<br />
Year Capital Expenditure as % of Total Expenditure<br />
Year Social Services<br />
1987/88 13.2%<br />
1988/89 13.5%<br />
1989/90 13.7%<br />
1990/91 20.7%<br />
1991/92 25.6%<br />
2.15 This has meant that there was insufficient recurrent provision for the additional capital investments and this,<br />
combined with severe reductions in recurrent costs on existing programmes in the 1990/91 and 1991/92 budgets,<br />
generated pressure on the Government to make substantial increases in the recurrent budget in the first year of the<br />
7FYP.<br />
6<br />
Planned Actual<br />
GENERAL PUBLIC SERVICES 21.1% 21.6%<br />
EDUCATION 8.3% 10.9%<br />
HEALTH 4.3% 5.0%<br />
OTHER COMMUNITY SERVICES 1.0% 6.5%<br />
ECONOMIC SERVICES 65.2% 52.3%<br />
Business, Commerce & Trade<br />
+ Mining and Manufacturing<br />
Agriculture & Non-Mineral Resources<br />
Public Works<br />
Power and Technology<br />
Transport and Communications<br />
15.2%<br />
17.5%<br />
12.2%<br />
13.4%<br />
6.9%<br />
6.6%<br />
15.6%<br />
8.9%<br />
9.6%<br />
11.7%<br />
OTHERS 0.0% 3.7%<br />
TOTAL 100.0% 100.0%<br />
Sources: 6FYP planned allocation from Table 2.2 of 6FYP. Actual expenditures from Annual Statements of Account, DNBA. Budgeted, not<br />
actual, expenditures are used for 1990/91 and 1991/92. Notes: 6FYP figures exclude 2.5% allocated for dzongkhags, as sectoral breakdown of<br />
this figure is not available.