COUNTRY BACKGROUND - Gross National Happiness Commission
COUNTRY BACKGROUND - Gross National Happiness Commission
COUNTRY BACKGROUND - Gross National Happiness Commission

You also want an ePaper? Increase the reach of your titles
YUMPU automatically turns print PDFs into web optimized ePapers that Google loves.
Economic Outlook<br />
to increases in GDP will not be significant during the 7FYP. Exploitation of another of Bhutan's major natural<br />
resources, its forests, will proceed cautiously, to ensure that development is not environmentally damaging. While<br />
production is expected to increase in this sector, it is unlikely that the share of forestry in total GDP will expand<br />
significantly. There is also scope for continued growth of the agriculture and livestock sectors, mainly through<br />
improved productivity (see Chapter 17).<br />
7.7 Because of the limitations described above, the sector which seems to have the greatest potential for rapid<br />
growth during 7FYP is manufacturing. Starting from a small base, manufacturing grew at over 15% p.a. during the<br />
1980s. Because the base is still quite small, few large-scale projects could ensure continued rapid growth of the<br />
sector. As will be described in Chapter 18, the ferro-silicon plant and another proposed cement factory (Dungsum)<br />
are the largest investments foreseen in the sector. Growth of the smaller establishments within manufacturing will<br />
also be encouraged to increase income and employment opportunities for all the population throughout the country.<br />
Tourism is another significant potential foreign exchange earner. The Royal Government has opted for selective<br />
tourism to minimise the possible adverse impact on its culture and environment. The number of tourists has been<br />
limited to below a ceiling of 4,000 tourists a year. Recognising the potential of this sector, the Government has<br />
privatised the Bhutan Tourism Corporation and will encourage the tour companies to increase their marketing<br />
activities abroad to attract a higher number of tourists.<br />
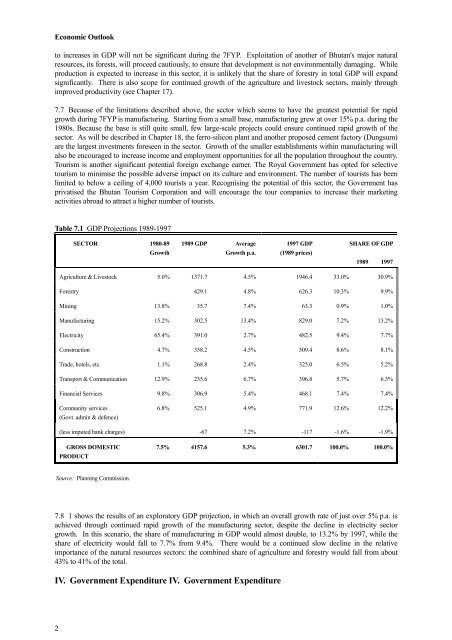
Table 7.1 GDP Projections 1989-1997<br />
7.8 1 shows the results of an exploratory GDP projection, in which an overall growth rate of just over 5% p.a. is<br />
achieved through continued rapid growth of the manufacturing sector, despite the decline in electricity sector<br />
growth. In this scenario, the share of manufacturing in GDP would almost double, to 13.2% by 1997, while the<br />
share of electricity would fall to 7.7% from 9.4%. There would be a continued slow decline in the relative<br />
importance of the natural resources sectors: the combined share of agriculture and forestry would fall from about<br />
43% to 41% of the total.<br />
IV. Government Expenditure IV. Government Expenditure<br />
2<br />
SECTOR 1980-89<br />
Growth<br />
1989 GDP Average<br />
Growth p.a.<br />
1997 GDP<br />
(1989 prices)<br />
SHARE OF GDP<br />
1989 1997<br />
Agriculture & Livestock 5.0% 1371.7 4.5% 1946.4 33.0% 30.9%<br />
Forestry 429.1 4.8% 626.3 10.3% 9.9%<br />
Mining 13.8% 35.7 7.4% 63.3 0.9% 1.0%<br />
Manufacturing 15.2% 302.5 13.4% 829.0 7.2% 13.2%<br />
Electricity 65.4% 391.0 2.7% 482.5 9.4% 7.7%<br />
Construction 4.7% 358.2 4.5% 509.4 8.6% 8.1%<br />
Trade, hotels, etc. 1.1% 268.8 2.4% 325.0 6.5% 5.2%<br />
Transport & Communication 12.9% 235.6 6.7% 396.8 5.7% 6.3%<br />
Financial Services 9.8% 306.9 5.4% 468.1 7.4% 7.4%<br />
Community services<br />
(Govt. admin & defence)<br />
6.8% 525.1 4.9% 771.9 12.6% 12.2%<br />
(less imputed bank charges) -67 7.2% -117 -1.6% -1.9%<br />
GROSS DOMESTIC<br />
PRODUCT<br />
Source: Planning <strong>Commission</strong>.<br />
7.5% 4157.6 5.3% 6301.7 100.0% 100.0%