COUNTRY BACKGROUND - Gross National Happiness Commission
COUNTRY BACKGROUND - Gross National Happiness Commission
COUNTRY BACKGROUND - Gross National Happiness Commission

Create successful ePaper yourself
Turn your PDF publications into a flip-book with our unique Google optimized e-Paper software.
Economic Performance<br />
12<br />
electricity sales.<br />
(c) The momentum of Government expenditure growth continued, leading towards budget deficits.<br />
(d) The financing of the government deficit by borrowing from the RMA led to an increase in domestic<br />
demand, which quickly leaked into imports and started a rapid decline in Bhutan's reserves of rupees,<br />
as explained above.<br />
2.28 Recognising the problem, and the need for macroeconomic stabilisation, the Government adopted a very<br />
restrictive budget for 1991/92. In planning for RGOB expenditures in the 7FYP, it has been necessary to take into<br />
account the factors described above. These are discussed in more detail in Chapter 7, Economic Outlook.<br />
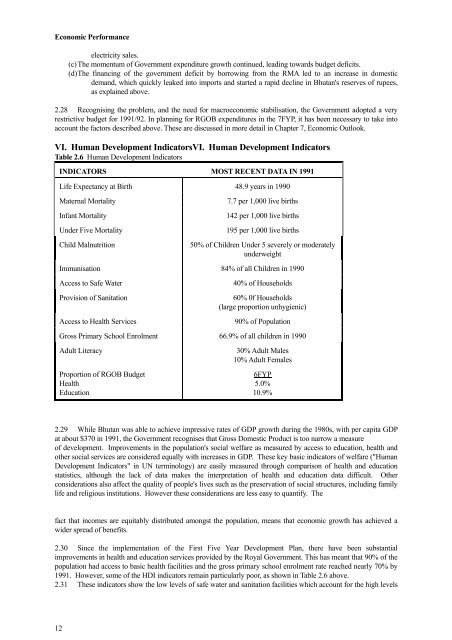
VI. Human Development IndicatorsVI. Human Development Indicators<br />
Table 2.6 Human Development Indicators<br />
INDICATORS MOST RECENT DATA IN 1991<br />
Life Expectancy at Birth 48.9 years in 1990<br />
Maternal Mortality 7.7 per 1,000 live births<br />
Infant Mortality 142 per 1,000 live births<br />
Under Five Mortality 195 per 1,000 live births<br />
Child Malnutrition 50% of Children Under 5 severely or moderately<br />
underweight<br />
Immunisation 84% of all Children in 1990<br />
Access to Safe Water 40% of Households<br />
Provision of Sanitation 60% 0f Households<br />
(large proportion unhygienic)<br />
Access to Health Services 90% of Population<br />
<strong>Gross</strong> Primary School Enrolment 66.9% of all children in 1990<br />
Adult Literacy 30% Adult Males<br />
10% Adult Females<br />
Proportion of RGOB Budget<br />
Health<br />
Education<br />
6FYP<br />
5.0%<br />
10.9%<br />
2.29 While Bhutan was able to achieve impressive rates of GDP growth during the 1980s, with per capita GDP<br />
at about $370 in 1991, the Government recognises that <strong>Gross</strong> Domestic Product is too narrow a measure<br />
of development. Improvements in the population's social welfare as measured by access to education, health and<br />
other social services are considered equally with increases in GDP. These key basic indicators of welfare ("Human<br />
Development Indicators" in UN terminology) are easily measured through comparison of health and education<br />
statistics, although the lack of data makes the interpretation of health and education data difficult. Other<br />
considerations also affect the quality of people's lives such as the preservation of social structures, including family<br />
life and religious institutions. However these considerations are less easy to quantify. The<br />
fact that incomes are equitably distributed amongst the population, means that economic growth has achieved a<br />
wider spread of benefits.<br />
2.30 Since the implementation of the First Five Year Development Plan, there have been substantial<br />
improvements in health and education services provided by the Royal Government. This has meant that 90% of the<br />
population had access to basic health facilities and the gross primary school enrolment rate reached nearly 70% by<br />
1991. However, some of the HDI indicators remain particularly poor, as shown in Table 2.6 above.<br />
2.31 These indicators show the low levels of safe water and sanitation facilities which account for the high levels