

Energy in Australia
Energy-in-Australia-2015
Energy-in-Australia-2015

You also want an ePaper? Increase the reach of your titles
YUMPU automatically turns print PDFs into web optimized ePapers that Google loves.
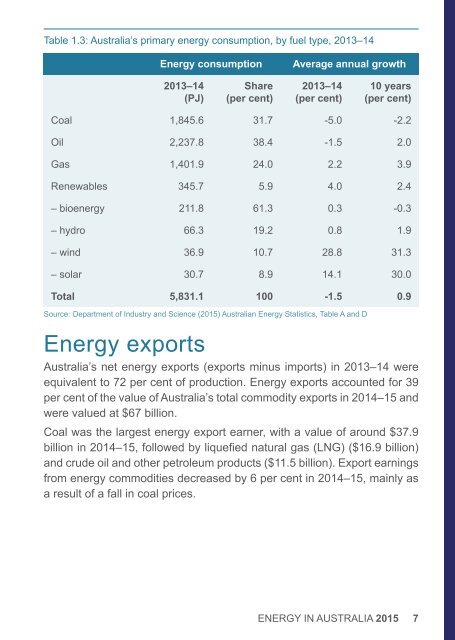
Table 1.3: <strong>Australia</strong>’s primary energy consumption, by fuel type, 2013–14<br />
<strong>Energy</strong> consumption<br />
Average annual growth<br />
2013–14<br />
(PJ)<br />
Share<br />
(per cent)<br />
2013–14<br />
(per cent)<br />
10 years<br />
(per cent)<br />
Coal 1,845.6 31.7 -5.0 -2.2<br />
Oil 2,237.8 38.4 -1.5 2.0<br />
Gas 1,401.9 24.0 2.2 3.9<br />
Renewables 345.7 5.9 4.0 2.4<br />
– bioenergy 211.8 61.3 0.3 -0.3<br />
– hydro 66.3 19.2 0.8 1.9<br />
– w<strong>in</strong>d 36.9 10.7 28.8 31.3<br />
– solar 30.7 8.9 14.1 30.0<br />
Total 5,831.1 100 -1.5 0.9<br />
Source: Department of Industry and Science (2015) <strong>Australia</strong>n <strong>Energy</strong> Statistics, Table A and D<br />
<strong>Energy</strong> exports<br />
<strong>Australia</strong>’s net energy exports (exports m<strong>in</strong>us imports) <strong>in</strong> 2013–14 were<br />
equivalent to 72 per cent of production. <strong>Energy</strong> exports accounted for 39<br />
per cent of the value of <strong>Australia</strong>’s total commodity exports <strong>in</strong> 2014–15 and<br />
were valued at $67 billion.<br />
Coal was the largest energy export earner, with a value of around $37.9<br />
billion <strong>in</strong> 2014–15, followed by liquefied natural gas (LNG) ($16.9 billion)<br />
and crude oil and other petroleum products ($11.5 billion). Export earn<strong>in</strong>gs<br />
from energy commodities decreased by 6 per cent <strong>in</strong> 2014–15, ma<strong>in</strong>ly as<br />
a result of a fall <strong>in</strong> coal prices.<br />
ENERGY IN AUSTRALIA 2015 7