

Energy in Australia
Energy-in-Australia-2015
Energy-in-Australia-2015

You also want an ePaper? Increase the reach of your titles
YUMPU automatically turns print PDFs into web optimized ePapers that Google loves.
Table 3.6: Total f<strong>in</strong>al energy consumption, by state, 2013–14<br />
Coal Gas Oil Electricity Renewables Total<br />
NSW a 12.1 97.8 612.0 236.6 49.4 1,007.9<br />
NT 0.0 21.2 42.7 12.2 0.4 76.4<br />
QLD 48.5 105.9 510.8 181.5 87.4 934.0<br />
SA 3.1 58.6 124.4 49.3 10.8 246.3<br />
TAS 11.4 3.6 39.5 39.6 7.2 101.2<br />
VIC 4.2 246.7 441.3 148.1 28.8 869.1<br />
WA 34.9 2,91.7 366.0 122.6 10.0 825.2<br />
<strong>Australia</strong> 114.1 825.5 2,136.6 789.9 194.0 4,060.1<br />
Notes: (a) <strong>in</strong>cludes ACT<br />
Source: Department of Industry and Science (2015) <strong>Australia</strong>n <strong>Energy</strong> Statistics, unpublished data<br />
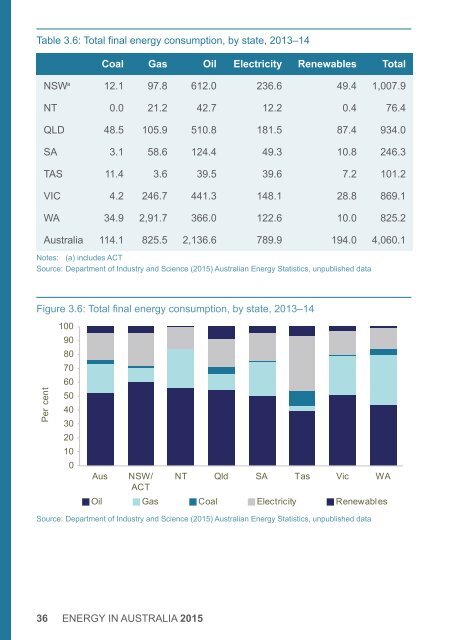
Figure 3.6: Total f<strong>in</strong>al energy consumption, by state, 2013–14<br />
Per cent<br />
100<br />
90<br />
80<br />
70<br />
60<br />
50<br />
40<br />
30<br />
20<br />
10<br />
0<br />
Aus<br />
NSW/<br />
ACT<br />
NT Qld SA Tas Vic WA<br />
Oil Gas Coal Electricity Renewables<br />
Source: Department of Industry and Science (2015) <strong>Australia</strong>n <strong>Energy</strong> Statistics, unpublished data<br />
36 ENERGY IN AUSTRALIA 2015