

Energy in Australia
Energy-in-Australia-2015
Energy-in-Australia-2015

Create successful ePaper yourself
Turn your PDF publications into a flip-book with our unique Google optimized e-Paper software.
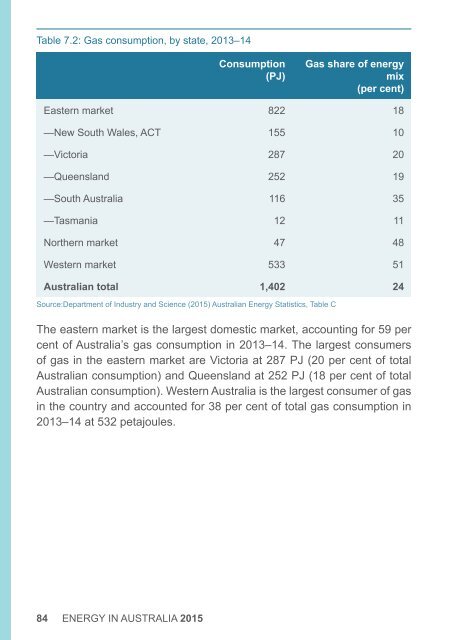
Table 7.2: Gas consumption, by state, 2013–14<br />
Consumption<br />
(PJ)<br />
Gas share of energy<br />
mix<br />
(per cent)<br />
Eastern market 822 18<br />
—New South Wales, ACT 155 10<br />
—Victoria 287 20<br />
—Queensland 252 19<br />
—South <strong>Australia</strong> 116 35<br />
—Tasmania 12 11<br />
Northern market 47 48<br />
Western market 533 51<br />
<strong>Australia</strong>n total 1,402 24<br />
Source:Department of Industry and Science (2015) <strong>Australia</strong>n <strong>Energy</strong> Statistics, Table C<br />
The eastern market is the largest domestic market, account<strong>in</strong>g for 59 per<br />
cent of <strong>Australia</strong>’s gas consumption <strong>in</strong> 2013–14. The largest consumers<br />
of gas <strong>in</strong> the eastern market are Victoria at 287 PJ (20 per cent of total<br />
<strong>Australia</strong>n consumption) and Queensland at 252 PJ (18 per cent of total<br />
<strong>Australia</strong>n consumption). Western <strong>Australia</strong> is the largest consumer of gas<br />
<strong>in</strong> the country and accounted for 38 per cent of total gas consumption <strong>in</strong><br />
2013–14 at 532 petajoules.<br />
84 ENERGY IN AUSTRALIA 2015