

Energy in Australia
Energy-in-Australia-2015
Energy-in-Australia-2015

You also want an ePaper? Increase the reach of your titles
YUMPU automatically turns print PDFs into web optimized ePapers that Google loves.
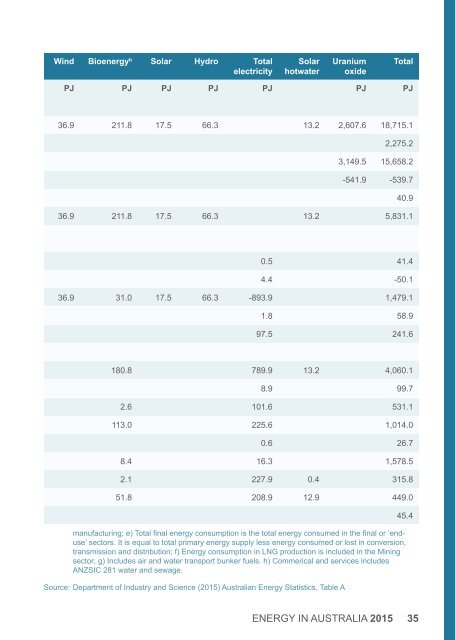
W<strong>in</strong>d Bioenergy b Solar Hydro Total<br />
electricity<br />
Solar<br />
hotwater<br />
Uranium<br />
oxide<br />
Total<br />
PJ PJ PJ PJ PJ PJ PJ<br />
36.9 211.8 17.5 66.3 13.2 2,607.6 18,715.1<br />
2,275.2<br />
3,149.5 15,658.2<br />
-541.9 -539.7<br />
40.9<br />
36.9 211.8 17.5 66.3 13.2 5,831.1<br />
0.5 41.4<br />
4.4 -50.1<br />
36.9 31.0 17.5 66.3 -893.9 1,479.1<br />
1.8 58.9<br />
97.5 241.6<br />
180.8 789.9 13.2 4,060.1<br />
8.9 99.7<br />
2.6 101.6 531.1<br />
113.0 225.6 1,014.0<br />
0.6 26.7<br />
8.4 16.3 1,578.5<br />
2.1 227.9 0.4 315.8<br />
51.8 208.9 12.9 449.0<br />
manufactur<strong>in</strong>g; e) Total f<strong>in</strong>al energy consumption is the total energy consumed <strong>in</strong> the f<strong>in</strong>al or ‘enduse’<br />
sectors. It is equal to total primary energy supply less energy consumed or lost <strong>in</strong> conversion,<br />
transmission and distribution; f) <strong>Energy</strong> consumption <strong>in</strong> LNG production is <strong>in</strong>cluded <strong>in</strong> the M<strong>in</strong><strong>in</strong>g<br />
sector; g) Includes air and water transport bunker fuels. h) Commerical and services <strong>in</strong>cludes<br />
ANZSIC 281 water and sewage.<br />
Source: Department of Industry and Science (2015) <strong>Australia</strong>n <strong>Energy</strong> Statistics, Table A<br />
45.4<br />
ENERGY IN AUSTRALIA 2015 35