

Earning Power
1p4Cz9a
1p4Cz9a

Create successful ePaper yourself
Turn your PDF publications into a flip-book with our unique Google optimized e-Paper software.
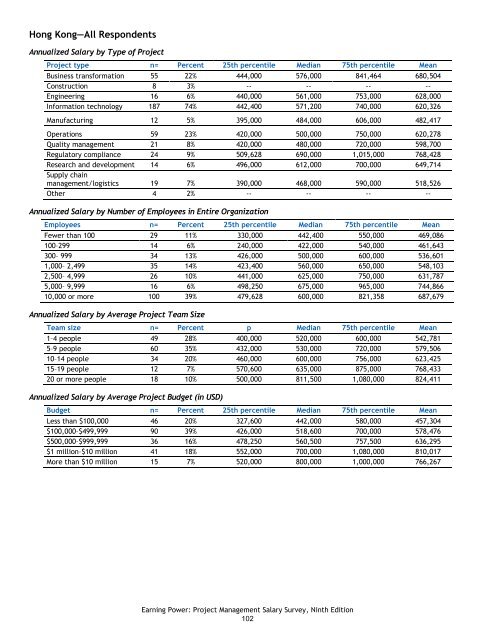
Hong Kong—All Respondents<br />
Annualized Salary by Type of Project<br />
Project type n= Percent 25th percentile Median 75th percentile Mean<br />
Business transformation 55 22% 444,000 576,000 841,464 680,504<br />
Construction 8 3% -- -- -- --<br />
Engineering 16 6% 440,000 561,000 753,000 628,000<br />
Information technology 187 74% 442,400 571,200 740,000 620,326<br />
Manufacturing 12 5% 395,000 484,000 606,000 482,417<br />
Operations 59 23% 420,000 500,000 750,000 620,278<br />
Quality management 21 8% 420,000 480,000 720,000 598,700<br />
Regulatory compliance 24 9% 509,628 690,000 1,015,000 768,428<br />
Research and development 14 6% 496,000 612,000 700,000 649,714<br />
Supply chain<br />
management/logistics 19 7% 390,000 468,000 590,000 518,526<br />
Other 4 2% -- -- -- --<br />
Annualized Salary by Number of Employees in Entire Organization<br />
Employees n= Percent 25th percentile Median 75th percentile Mean<br />
Fewer than 100 29 11% 330,000 442,400 550,000 469,086<br />
100–299 14 6% 240,000 422,000 540,000 461,643<br />
300– 999 34 13% 426,000 500,000 600,000 536,601<br />
1,000– 2,499 35 14% 423,400 560,000 650,000 548,103<br />
2,500– 4,999 26 10% 441,000 625,000 750,000 631,787<br />
5,000– 9,999 16 6% 498,250 675,000 965,000 744,866<br />
10,000 or more 100 39% 479,628 600,000 821,358 687,679<br />
Annualized Salary by Average Project Team Size<br />
Team size n= Percent p Median 75th percentile Mean<br />
1–4 people 49 28% 400,000 520,000 600,000 542,781<br />
5–9 people 60 35% 432,000 530,000 720,000 579,506<br />
10–14 people 34 20% 460,000 600,000 756,000 623,425<br />
15–19 people 12 7% 570,600 635,000 875,000 768,433<br />
20 or more people 18 10% 500,000 811,500 1,080,000 824,411<br />
Annualized Salary by Average Project Budget (in USD)<br />
Budget n= Percent 25th percentile Median 75th percentile Mean<br />
Less than $100,000 46 20% 327,600 442,000 580,000 457,304<br />
$100,000–$499,999 90 39% 426,000 518,600 700,000 578,476<br />
$500,000–$999,999 36 16% 478,250 560,500 757,500 636,295<br />
$1 million–$10 million 41 18% 552,000 700,000 1,080,000 810,017<br />
More than $10 million 15 7% 520,000 800,000 1,000,000 766,267<br />
<strong>Earning</strong> <strong>Power</strong>: Project Management Salary Survey, Ninth Edition<br />
102