

Earning Power
1p4Cz9a
1p4Cz9a

Create successful ePaper yourself
Turn your PDF publications into a flip-book with our unique Google optimized e-Paper software.
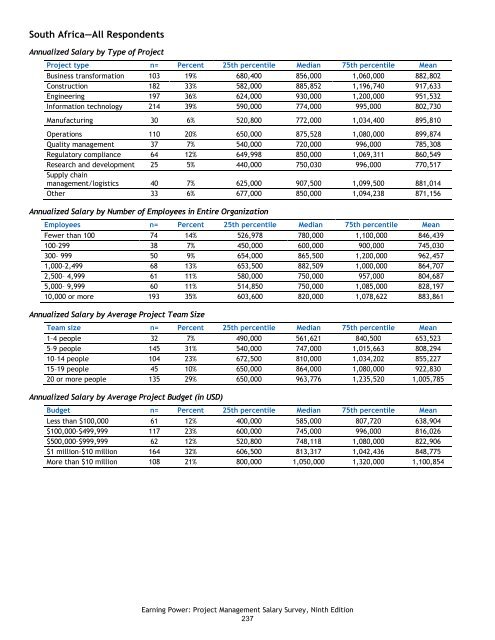
South Africa—All Respondents<br />
Annualized Salary by Type of Project<br />
Project type n= Percent 25th percentile Median 75th percentile Mean<br />
Business transformation 103 19% 680,400 856,000 1,060,000 882,802<br />
Construction 182 33% 582,000 885,852 1,196,740 917,633<br />
Engineering 197 36% 624,000 930,000 1,200,000 951,532<br />
Information technology 214 39% 590,000 774,000 995,000 802,730<br />
Manufacturing 30 6% 520,800 772,000 1,034,400 895,810<br />
Operations 110 20% 650,000 875,528 1,080,000 899,874<br />
Quality management 37 7% 540,000 720,000 996,000 785,308<br />
Regulatory compliance 64 12% 649,998 850,000 1,069,311 860,549<br />
Research and development 25 5% 440,000 750,030 996,000 770,517<br />
Supply chain<br />
management/logistics 40 7% 625,000 907,500 1,099,500 881,014<br />
Other 33 6% 677,000 850,000 1,094,238 871,156<br />
Annualized Salary by Number of Employees in Entire Organization<br />
Employees n= Percent 25th percentile Median 75th percentile Mean<br />
Fewer than 100 74 14% 526,978 780,000 1,100,000 846,439<br />
100–299 38 7% 450,000 600,000 900,000 745,030<br />
300– 999 50 9% 654,000 865,500 1,200,000 962,457<br />
1,000–2,499 68 13% 653,500 882,509 1,000,000 864,707<br />
2,500– 4,999 61 11% 580,000 750,000 957,000 804,687<br />
5,000– 9,999 60 11% 514,850 750,000 1,085,000 828,197<br />
10,000 or more 193 35% 603,600 820,000 1,078,622 883,861<br />
Annualized Salary by Average Project Team Size<br />
Team size n= Percent 25th percentile Median 75th percentile Mean<br />
1–4 people 32 7% 490,000 561,621 840,500 653,523<br />
5–9 people 145 31% 540,000 747,000 1,015,663 808,294<br />
10–14 people 104 23% 672,500 810,000 1,034,202 855,227<br />
15–19 people 45 10% 650,000 864,000 1,080,000 922,830<br />
20 or more people 135 29% 650,000 963,776 1,235,520 1,005,785<br />
Annualized Salary by Average Project Budget (in USD)<br />
Budget n= Percent 25th percentile Median 75th percentile Mean<br />
Less than $100,000 61 12% 400,000 585,000 807,720 638,904<br />
$100,000–$499,999 117 23% 600,000 745,000 996,000 816,026<br />
$500,000–$999,999 62 12% 520,800 748,118 1,080,000 822,906<br />
$1 million–$10 million 164 32% 606,500 813,317 1,042,436 848,775<br />
More than $10 million 108 21% 800,000 1,050,000 1,320,000 1,100,854<br />
<strong>Earning</strong> <strong>Power</strong>: Project Management Salary Survey, Ninth Edition<br />
237