

Earning Power
1p4Cz9a
1p4Cz9a

Create successful ePaper yourself
Turn your PDF publications into a flip-book with our unique Google optimized e-Paper software.
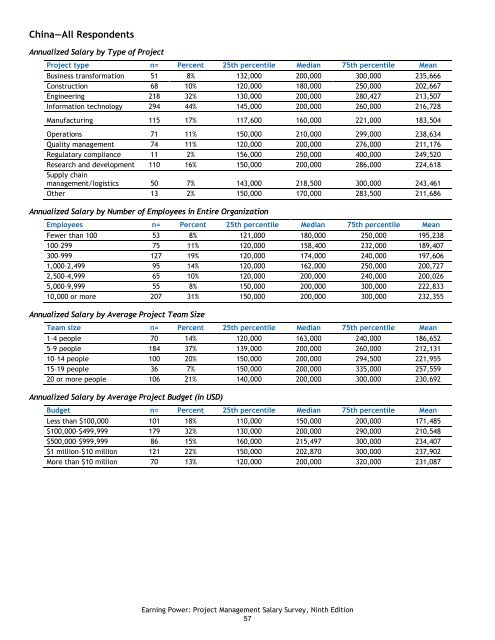
China—All Respondents<br />
Annualized Salary by Type of Project<br />
Project type n= Percent 25th percentile Median 75th percentile Mean<br />
Business transformation 51 8% 132,000 200,000 300,000 235,666<br />
Construction 68 10% 120,000 180,000 250,000 202,667<br />
Engineering 218 32% 130,000 200,000 280,427 213,507<br />
Information technology 294 44% 145,000 200,000 260,000 216,728<br />
Manufacturing 115 17% 117,600 160,000 221,000 183,504<br />
Operations 71 11% 150,000 210,000 299,000 238,634<br />
Quality management 74 11% 120,000 200,000 276,000 211,176<br />
Regulatory compliance 11 2% 156,000 250,000 400,000 249,520<br />
Research and development 110 16% 150,000 200,000 286,000 224,618<br />
Supply chain<br />
management/logistics 50 7% 143,000 218,500 300,000 243,461<br />
Other 13 2% 150,000 170,000 283,500 211,686<br />
Annualized Salary by Number of Employees in Entire Organization<br />
Employees n= Percent 25th percentile Median 75th percentile Mean<br />
Fewer than 100 53 8% 121,000 180,000 250,000 195,238<br />
100–299 75 11% 120,000 158,400 232,000 189,407<br />
300–999 127 19% 120,000 174,000 240,000 197,606<br />
1,000–2,499 95 14% 120,000 162,000 250,000 200,727<br />
2,500–4,999 65 10% 120,000 200,000 240,000 200,026<br />
5,000–9,999 55 8% 150,000 200,000 300,000 222,833<br />
10,000 or more 207 31% 150,000 200,000 300,000 232,355<br />
Annualized Salary by Average Project Team Size<br />
Team size n= Percent 25th percentile Median 75th percentile Mean<br />
1–4 people 70 14% 120,000 163,000 240,000 186,652<br />
5–9 people 184 37% 139,000 200,000 260,000 212,131<br />
10–14 people 100 20% 150,000 200,000 294,500 221,955<br />
15–19 people 36 7% 150,000 200,000 335,000 257,559<br />
20 or more people 106 21% 140,000 200,000 300,000 230,692<br />
Annualized Salary by Average Project Budget (in USD)<br />
Budget n= Percent 25th percentile Median 75th percentile Mean<br />
Less than $100,000 101 18% 110,000 150,000 200,000 171,485<br />
$100,000–$499,999 179 32% 130,000 200,000 290,000 210,548<br />
$500,000–$999,999 86 15% 160,000 215,497 300,000 234,407<br />
$1 million–$10 million 121 22% 150,000 202,870 300,000 237,902<br />
More than $10 million 70 13% 120,000 200,000 320,000 231,087<br />
<strong>Earning</strong> <strong>Power</strong>: Project Management Salary Survey, Ninth Edition<br />
57