

Earning Power
1p4Cz9a
1p4Cz9a

You also want an ePaper? Increase the reach of your titles
YUMPU automatically turns print PDFs into web optimized ePapers that Google loves.
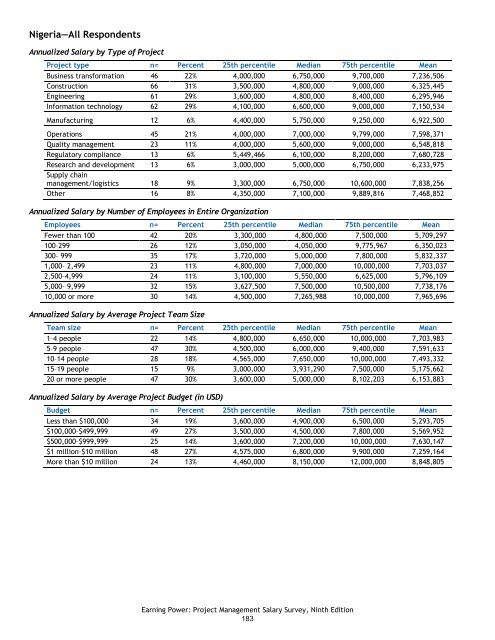
Nigeria—All Respondents<br />
Annualized Salary by Type of Project<br />
Project type n= Percent 25th percentile Median 75th percentile Mean<br />
Business transformation 46 22% 4,000,000 6,750,000 9,700,000 7,236,506<br />
Construction 66 31% 3,500,000 4,800,000 9,000,000 6,325,445<br />
Engineering 61 29% 3,600,000 4,800,000 8,400,000 6,295,946<br />
Information technology 62 29% 4,100,000 6,600,000 9,000,000 7,150,534<br />
Manufacturing 12 6% 4,400,000 5,750,000 9,250,000 6,922,500<br />
Operations 45 21% 4,000,000 7,000,000 9,799,000 7,598,371<br />
Quality management 23 11% 4,000,000 5,600,000 9,000,000 6,548,818<br />
Regulatory compliance 13 6% 5,449,466 6,100,000 8,200,000 7,680,728<br />
Research and development 13 6% 3,000,000 5,000,000 6,750,000 6,233,975<br />
Supply chain<br />
management/logistics 18 9% 3,300,000 6,750,000 10,600,000 7,838,256<br />
Other 16 8% 4,350,000 7,100,000 9,889,816 7,468,852<br />
Annualized Salary by Number of Employees in Entire Organization<br />
Employees n= Percent 25th percentile Median 75th percentile Mean<br />
Fewer than 100 42 20% 3,300,000 4,800,000 7,500,000 5,709,297<br />
100–299 26 12% 3,050,000 4,050,000 9,775,967 6,350,023<br />
300– 999 35 17% 3,720,000 5,000,000 7,800,000 5,832,337<br />
1,000– 2,499 23 11% 4,800,000 7,000,000 10,000,000 7,703,037<br />
2,500–4,999 24 11% 3,100,000 5,550,000 6,625,000 5,796,109<br />
5,000– 9,999 32 15% 3,627,500 7,500,000 10,500,000 7,738,176<br />
10,000 or more 30 14% 4,500,000 7,265,988 10,000,000 7,965,696<br />
Annualized Salary by Average Project Team Size<br />
Team size n= Percent 25th percentile Median 75th percentile Mean<br />
1–4 people 22 14% 4,800,000 6,650,000 10,000,000 7,703,983<br />
5–9 people 47 30% 4,500,000 6,000,000 9,400,000 7,591,633<br />
10–14 people 28 18% 4,565,000 7,650,000 10,000,000 7,493,332<br />
15–19 people 15 9% 3,000,000 3,931,290 7,500,000 5,175,662<br />
20 or more people 47 30% 3,600,000 5,000,000 8,102,203 6,153,883<br />
Annualized Salary by Average Project Budget (in USD)<br />
Budget n= Percent 25th percentile Median 75th percentile Mean<br />
Less than $100,000 34 19% 3,600,000 4,900,000 6,500,000 5,293,705<br />
$100,000–$499,999 49 27% 3,500,000 4,500,000 7,800,000 5,569,952<br />
$500,000–$999,999 25 14% 3,600,000 7,200,000 10,000,000 7,630,147<br />
$1 million–$10 million 48 27% 4,575,000 6,800,000 9,900,000 7,259,164<br />
More than $10 million 24 13% 4,460,000 8,150,000 12,000,000 8,848,805<br />
<strong>Earning</strong> <strong>Power</strong>: Project Management Salary Survey, Ninth Edition<br />
183