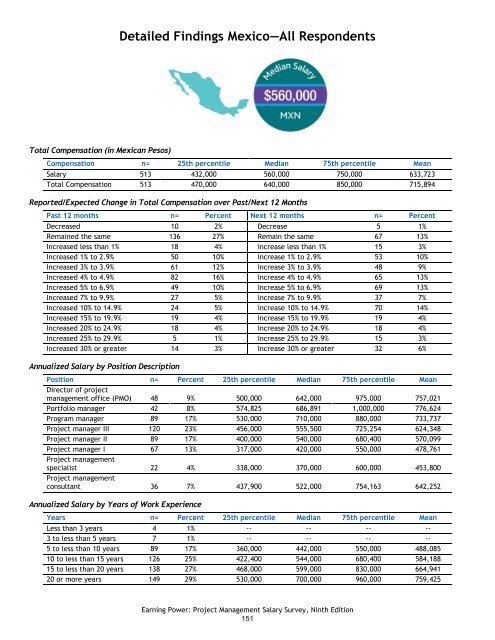
Detailed Findings Mexico—All Respondents Total Compensation (in Mexican Pesos) Compensation n= 25th percentile Median 75th percentile Mean Salary 513 432,000 560,000 750,000 633,723 Total Compensation 513 470,000 640,000 850,000 715,894 Reported/Expected Change in Total Compensation over Past/Next 12 Months Past 12 months n= Percent Next 12 months n= Percent Decreased 10 2% Decrease 5 1% Remained the same 136 27% Remain the same 67 13% Increased less than 1% 18 4% Increase less than 1% 15 3% Increased 1% to 2.9% 50 10% Increase 1% to 2.9% 53 10% Increased 3% to 3.9% 61 12% Increase 3% to 3.9% 48 9% Increased 4% to 4.9% 82 16% Increase 4% to 4.9% 65 13% Increased 5% to 6.9% 49 10% Increase 5% to 6.9% 69 13% Increased 7% to 9.9% 27 5% Increase 7% to 9.9% 37 7% Increased 10% to 14.9% 24 5% Increase 10% to 14.9% 70 14% Increased 15% to 19.9% 19 4% Increase 15% to 19.9% 19 4% Increased 20% to 24.9% 18 4% Increase 20% to 24.9% 18 4% Increased 25% to 29.9% 5 1% Increase 25% to 29.9% 15 3% Increased 30% or greater 14 3% Increase 30% or greater 32 6% Annualized Salary by Position Description Position n= Percent 25th percentile Median 75th percentile Mean Director of project management office (PMO) 48 9% 500,000 642,000 975,000 757,021 Portfolio manager 42 8% 574,825 686,891 1,000,000 776,624 Program manager 89 17% 530,000 710,000 880,000 733,737 Project manager III 120 23% 456,000 555,500 725,254 624,348 Project manager II 89 17% 400,000 540,000 680,400 570,099 Project manager I 67 13% 317,000 420,000 550,000 478,761 Project management specialist 22 4% 338,000 370,000 600,000 453,800 Project management consultant 36 7% 437,900 522,000 754,163 642,252 Annualized Salary by Years of Work Experience Years n= Percent 25th percentile Median 75th percentile Mean Less than 3 years 4 1% -- -- -- -- 3 to less than 5 years 7 1% -- -- -- -- 5 to less than 10 years 89 17% 360,000 442,000 550,000 488,085 10 to less than 15 years 126 25% 422,400 544,000 680,400 584,188 15 to less than 20 years 138 27% 468,000 599,000 830,000 664,941 20 or more years 149 29% 530,000 700,000 960,000 759,425 <strong>Earning</strong> <strong>Power</strong>: Project Management Salary Survey, Ninth Edition 151
Mexico—All Respondents Annualized Salary by Technique Experience Years n= Percent 25th percentile Median 75th percentile Mean Agile/interactive/incremental project management/Scrum None 181 36% 400,000 550,000 720,000 602,631 1 to 5 years 250 50% 421,216 550,748 730,043 626,322 6 years or more 65 13% 520,000 650,000 960,000 748,689 Extreme project management None 333 69% 420,000 551,495 724,547 616,954 1 to 5 years 100 21% 400,640 540,000 732,000 614,237 6 years or more 53 11% 500,000 700,000 1,053,000 791,403 Process-based project management None 82 16% 384,000 575,000 750,000 620,354 1 to 5 years 231 46% 400,000 511,000 660,000 564,238 6 years or more 188 38% 504,000 670,000 900,000 725,604 Event chain project management None 269 55% 430,000 585,000 780,000 639,578 1 to 5 years 158 32% 407,000 511,500 660,000 568,686 6 years or more 62 13% 540,000 720,000 1,030,000 790,842 Project portfolio management None 171 34% 384,000 511,000 711,000 578,422 1 to 5 years 219 44% 432,000 550,000 693,240 581,223 6 years or more 108 22% 540,000 780,000 1,047,500 829,892 Program management None 116 23% 390,000 500,000 666,000 566,348 1 to 5 years 243 49% 415,000 540,000 700,000 576,695 6 years or more 139 28% 540,000 720,000 1,041,264 797,590 Earned value management None 126 26% 400,000 516,000 660,000 559,127 1 to 5 years 246 50% 410,000 543,000 730,043 615,171 6 years or more 121 25% 540,000 700,000 931,032 756,830 Lean project management None 223 46% 430,000 548,249 730,508 614,691 1 to 5 years 195 40% 420,000 565,000 744,000 624,568 6 years or more 68 14% 446,400 648,000 1,010,000 721,335 <strong>Earning</strong> <strong>Power</strong>: Project Management Salary Survey, Ninth Edition 152
- Page 1 and 2:
Earning Power Project Management Sa
- Page 3 and 4:
Earning Power: Project Management S
- Page 5 and 6:
Detailed Findings Singapore—All R
- Page 7 and 8:
About PMI Project Management Instit
- Page 9 and 10:
Reporting of Compensation Data Alth
- Page 11 and 12:
Country of Employment As seen in th
- Page 13 and 14:
PMP ® Certification Status The maj
- Page 15 and 16:
Project Size The size of projects m
- Page 17 and 18:
Detailed Findings Australia—All R
- Page 19 and 20:
Australia—All Respondents Annuali
- Page 21 and 22:
Australia—All Respondents Annuali
- Page 23 and 24:
Australia—All Respondents Project
- Page 25 and 26:
Australia—All Respondents Annuali
- Page 27 and 28:
Belgium—All Respondents Annualize
- Page 29 and 30:
Belgium—All Respondents Annualize
- Page 31 and 32:
Belgium—All Respondents Annualize
- Page 33 and 34:
Belgium—All Respondents Mean Numb
- Page 35 and 36:
Detailed Findings Brazil—All Resp
- Page 37 and 38:
Brazil—All Respondents Annualized
- Page 39 and 40:
Brazil—All Respondents Annualized
- Page 41 and 42:
Brazil—All Respondents Project Ma
- Page 43 and 44:
Brazil—All Respondents Annualized
- Page 45 and 46:
Canada—All Respondents Annualized
- Page 47 and 48:
Canada—All Respondents Annualized
- Page 49 and 50:
Canada—All Respondents Annualized
- Page 51 and 52:
Canada—All Respondents Mean Numbe
- Page 53 and 54:
Detailed Findings China—All Respo
- Page 55 and 56:
China—All Respondents Annualized
- Page 57 and 58:
China—All Respondents Annualized
- Page 59 and 60:
China—All Respondents Project Man
- Page 61 and 62:
China—All Respondents Annualized
- Page 63 and 64:
Colombia—All Respondents Annualiz
- Page 65 and 66:
Colombia—All Respondents Annualiz
- Page 67 and 68:
Colombia—All Respondents Annualiz
- Page 69 and 70:
Colombia—All Respondents Mean Num
- Page 71 and 72:
Detailed Findings Egypt—All Respo
- Page 73 and 74:
Egypt—All Respondents Annualized
- Page 75 and 76:
Egypt—All Respondents Annualized
- Page 77 and 78:
Egypt—All Respondents Project Man
- Page 79 and 80:
Egypt—All Respondents Annualized
- Page 81 and 82:
France—All Respondents Annualized
- Page 83 and 84:
France—All Respondents Annualized
- Page 85 and 86:
France—All Respondents Annualized
- Page 87 and 88:
France—All Respondents Mean Numbe
- Page 89 and 90:
Detailed Findings Germany—All Res
- Page 91 and 92:
Germany—All Respondents Annualize
- Page 93 and 94:
Germany—All Respondents Annualize
- Page 95 and 96:
Germany—All Respondents Project M
- Page 97 and 98:
Germany—All Respondents Annualize
- Page 99 and 100:
Hong Kong—All Respondents Annuali
- Page 101 and 102: Hong Kong—All Respondents Annuali
- Page 103 and 104: Hong Kong—All Respondents Annuali
- Page 105 and 106: Hong Kong—All Respondents Mean Nu
- Page 107 and 108: Detailed Findings India—All Respo
- Page 109 and 110: India—All Respondents Annualized
- Page 111 and 112: India—All Respondents Annualized
- Page 113 and 114: India—All Respondents Project Man
- Page 115 and 116: India—All Respondents Annualized
- Page 117 and 118: Ireland—All Respondents Annualize
- Page 119 and 120: Ireland—All Respondents Annualize
- Page 121 and 122: Ireland—All Respondents Annualize
- Page 123 and 124: Ireland—All Respondents Mean Numb
- Page 125 and 126: Detailed Findings Italy—All Respo
- Page 127 and 128: Italy—All Respondents Annualized
- Page 129 and 130: Italy—All Respondents Annualized
- Page 131 and 132: Italy—All Respondents Project Man
- Page 133 and 134: Italy—All Respondents Annualized
- Page 135 and 136: Japan—All Respondents Annualized
- Page 137 and 138: Japan—All Respondents Annualized
- Page 139 and 140: Japan—All Respondents Annualized
- Page 141 and 142: Japan—All Respondents Mean Number
- Page 143 and 144: Detailed Findings Malaysia—All Re
- Page 145 and 146: Malaysia—All Respondents Annualiz
- Page 147 and 148: Malaysia—All Respondents Annualiz
- Page 149 and 150: Malaysia—All Respondents Project
- Page 151: Malaysia—All Respondents Annualiz
- Page 155 and 156: Mexico—All Respondents Annualized
- Page 157 and 158: Mexico—All Respondents Annualized
- Page 159 and 160: Mexico—All Respondents Mean Numbe
- Page 161 and 162: Detailed Findings Netherlands—All
- Page 163 and 164: Netherlands—All Respondents Annua
- Page 165 and 166: Netherlands—All Respondents Annua
- Page 167 and 168: Netherlands—All Respondents Proje
- Page 169 and 170: Netherlands—All Respondents Annua
- Page 171 and 172: New Zealand—All Respondents Annua
- Page 173 and 174: New Zealand—All Respondents Annua
- Page 175 and 176: New Zealand—All Respondents Annua
- Page 177 and 178: New Zealand—All Respondents Mean
- Page 179 and 180: Detailed Findings Nigeria—All Res
- Page 181 and 182: Nigeria—All Respondents Annualize
- Page 183 and 184: Nigeria—All Respondents Annualize
- Page 185 and 186: Nigeria—All Respondents Project M
- Page 187 and 188: Nigeria—All Respondents Annualize
- Page 189 and 190: Peru—All Respondents Annualized S
- Page 191 and 192: Peru—All Respondents Annualized S
- Page 193 and 194: Peru—All Respondents Annualized S
- Page 195 and 196: Peru—All Respondents Mean Number
- Page 197 and 198: Detailed Findings Poland—All Resp
- Page 199 and 200: Poland—All Respondents Annualized
- Page 201 and 202: Poland—All Respondents Annualized
- Page 203 and 204:
Poland—All Respondents Project Ma
- Page 205 and 206:
Poland—All Respondents Annualized
- Page 207 and 208:
Qatar—All Respondents Annualized
- Page 209 and 210:
Qatar—All Respondents Annualized
- Page 211 and 212:
Qatar—All Respondents Annualized
- Page 213 and 214:
Qatar—All Respondents Mean Number
- Page 215 and 216:
Detailed Findings Saudi Arabia—Al
- Page 217 and 218:
Saudi Arabia—All Respondents Annu
- Page 219 and 220:
Saudi Arabia—All Respondents Annu
- Page 221 and 222:
Saudi Arabia—All Respondents Proj
- Page 223 and 224:
Saudi Arabia—All Respondents Annu
- Page 225 and 226:
Singapore—All Respondents Annuali
- Page 227 and 228:
Singapore—All Respondents Annuali
- Page 229 and 230:
Singapore—All Respondents Annuali
- Page 231 and 232:
Singapore—All Respondents Mean Nu
- Page 233 and 234:
Detailed Findings South Africa—Al
- Page 235 and 236:
South Africa—All Respondents Annu
- Page 237 and 238:
South Africa—All Respondents Annu
- Page 239 and 240:
South Africa—All Respondents Proj
- Page 241 and 242:
South Africa—All Respondents Annu
- Page 243 and 244:
South Korea—All Respondents Annua
- Page 245 and 246:
South Korea—All Respondents Annua
- Page 247 and 248:
South Korea—All Respondents Annua
- Page 249 and 250:
South Korea—All Respondents Mean
- Page 251 and 252:
Detailed Findings Spain—All Respo
- Page 253 and 254:
Spain—All Respondents Annualized
- Page 255 and 256:
Spain—All Respondents Annualized
- Page 257 and 258:
Spain—All Respondents Project Man
- Page 259 and 260:
Spain—All Respondents Annualized
- Page 261 and 262:
Sweden—All Respondents Annualized
- Page 263 and 264:
Sweden—All Respondents Annualized
- Page 265 and 266:
Sweden—All Respondents Annualized
- Page 267 and 268:
Sweden—All Respondents Mean Numbe
- Page 269 and 270:
Detailed Findings Switzerland—All
- Page 271 and 272:
Switzerland—All Respondents Annua
- Page 273 and 274:
Switzerland—All Respondents Annua
- Page 275 and 276:
Switzerland—All Respondents Proje
- Page 277 and 278:
Switzerland—All Respondents Annua
- Page 279 and 280:
Taiwan—All Respondents Annualized
- Page 281 and 282:
Taiwan—All Respondents Annualized
- Page 283 and 284:
Taiwan—All Respondents Annualized
- Page 285 and 286:
Taiwan—All Respondents Mean Numbe
- Page 287 and 288:
Detailed Findings Turkey—All Resp
- Page 289 and 290:
Turkey—All Respondents Annualized
- Page 291 and 292:
Turkey—All Respondents Annualized
- Page 293 and 294:
Turkey—All Respondents Project Ma
- Page 295 and 296:
Turkey—All Respondents Annualized
- Page 297 and 298:
United Arab Emirates—All Responde
- Page 299 and 300:
United Arab Emirates—All Responde
- Page 301 and 302:
United Arab Emirates—All Responde
- Page 303 and 304:
United Arab Emirates—All Responde
- Page 305 and 306:
Detailed Findings United Kingdom—
- Page 307 and 308:
United Kingdom—All Respondents An
- Page 309 and 310:
United Kingdom—All Respondents An
- Page 311 and 312:
United Kingdom—All Respondents Pr
- Page 313 and 314:
United Kingdom—All Respondents An
- Page 315 and 316:
United States—All Respondents Ann
- Page 317 and 318:
United States—All Respondents Ann
- Page 319 and 320:
United States—All Respondents Ann
- Page 321 and 322:
United States—All Respondents Mea
- Page 323 and 324:
Years of Work Experience Appendix A
- Page 325 and 326:
Years of Technique Experience Agile
- Page 327 and 328:
Years of Technique Experience (Cont
- Page 329 and 330:
Years of Technique Experience (Cont
- Page 331 and 332:
Years of Technique Experience (Cont
- Page 333 and 334:
Degree in Project Management Countr
- Page 335 and 336:
Training Received Over Past 12 Mont
- Page 337 and 338:
Functional Area Country n= Admin/ g
- Page 339 and 340:
Type of Project Country n= Business
- Page 341 and 342:
Position Description Country n= Dir
- Page 343 and 344:
Employees Within Entire Organizatio
- Page 345 and 346:
Average Budget of Projects Country
- Page 347 and 348:
How do you expect your total compen
- Page 349 and 350:
Project Management Career Path Conn
- Page 351 and 352:
Equities Offered Country n= Stock o
- Page 353 and 354:
Mean Number of Vacation Days Countr
- Page 355 and 356:
Mean Hours Worked Country n= Hours
- Page 357 and 358:
(IF COUNTRY IS US, ASK:) 3) Please
- Page 359 and 360:
If you selected a certification fro
- Page 361 and 362:
the ROI from these projects and ens
- Page 363 and 364:
GUIDELINES FOR REPORTING COMPENSATI
- Page 365 and 366:
28) How has your total compensation
- Page 367 and 368:
(If there is a Career Path, ASK:) 4
- Page 369 and 370:
Appendix C—Sampling Methodology P
- Page 371:
Appendix D—Exchange Rates Currenc