

Earning Power
1p4Cz9a
1p4Cz9a

Create successful ePaper yourself
Turn your PDF publications into a flip-book with our unique Google optimized e-Paper software.
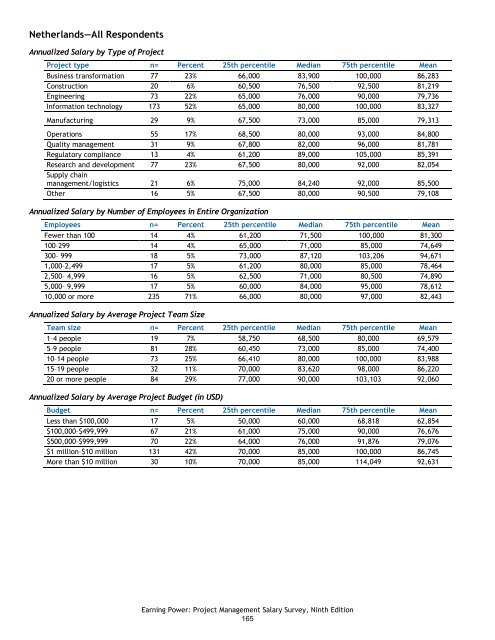
Netherlands—All Respondents<br />
Annualized Salary by Type of Project<br />
Project type n= Percent 25th percentile Median 75th percentile Mean<br />
Business transformation 77 23% 66,000 83,900 100,000 86,283<br />
Construction 20 6% 60,500 76,500 92,500 81,219<br />
Engineering 73 22% 65,000 76,000 90,000 79,736<br />
Information technology 173 52% 65,000 80,000 100,000 83,327<br />
Manufacturing 29 9% 67,500 73,000 85,000 79,313<br />
Operations 55 17% 68,500 80,000 93,000 84,800<br />
Quality management 31 9% 67,800 82,000 96,000 81,781<br />
Regulatory compliance 13 4% 61,200 89,000 105,000 85,391<br />
Research and development 77 23% 67,500 80,000 92,000 82,054<br />
Supply chain<br />
management/logistics 21 6% 75,000 84,240 92,000 85,500<br />
Other 16 5% 67,500 80,000 90,500 79,108<br />
Annualized Salary by Number of Employees in Entire Organization<br />
Employees n= Percent 25th percentile Median 75th percentile Mean<br />
Fewer than 100 14 4% 61,200 71,500 100,000 81,300<br />
100–299 14 4% 65,000 71,000 85,000 74,649<br />
300– 999 18 5% 73,000 87,120 103,206 94,671<br />
1,000–2,499 17 5% 61,200 80,000 85,000 78,464<br />
2,500– 4,999 16 5% 62,500 71,000 80,500 74,890<br />
5,000– 9,999 17 5% 60,000 84,000 95,000 78,612<br />
10,000 or more 235 71% 66,000 80,000 97,000 82,443<br />
Annualized Salary by Average Project Team Size<br />
Team size n= Percent 25th percentile Median 75th percentile Mean<br />
1–4 people 19 7% 58,750 68,500 80,000 69,579<br />
5–9 people 81 28% 60,450 73,000 85,000 74,400<br />
10–14 people 73 25% 66,410 80,000 100,000 83,988<br />
15–19 people 32 11% 70,000 83,620 98,000 86,220<br />
20 or more people 84 29% 77,000 90,000 103,103 92,060<br />
Annualized Salary by Average Project Budget (in USD)<br />
Budget n= Percent 25th percentile Median 75th percentile Mean<br />
Less than $100,000 17 5% 50,000 60,000 68,818 62,854<br />
$100,000–$499,999 67 21% 61,000 75,000 90,000 76,676<br />
$500,000–$999,999 70 22% 64,000 76,000 91,876 79,076<br />
$1 million–$10 million 131 42% 70,000 85,000 100,000 86,745<br />
More than $10 million 30 10% 70,000 85,000 114,049 92,631<br />
<strong>Earning</strong> <strong>Power</strong>: Project Management Salary Survey, Ninth Edition<br />
165