

Earning Power
1p4Cz9a
1p4Cz9a

You also want an ePaper? Increase the reach of your titles
YUMPU automatically turns print PDFs into web optimized ePapers that Google loves.
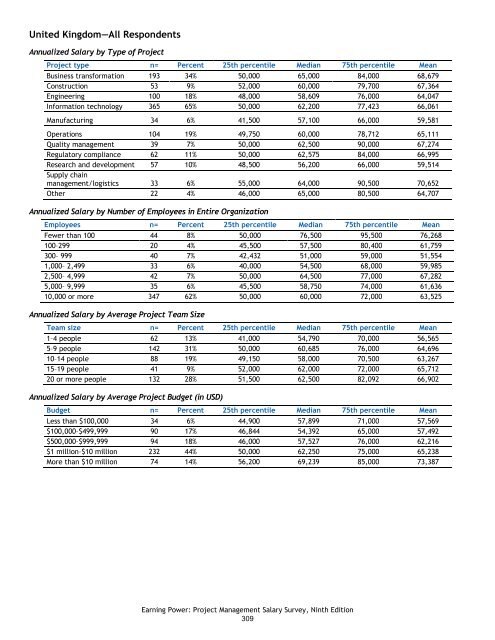
United Kingdom—All Respondents<br />
Annualized Salary by Type of Project<br />
Project type n= Percent 25th percentile Median 75th percentile Mean<br />
Business transformation 193 34% 50,000 65,000 84,000 68,679<br />
Construction 53 9% 52,000 60,000 79,700 67,364<br />
Engineering 100 18% 48,000 58,609 76,000 64,047<br />
Information technology 365 65% 50,000 62,200 77,423 66,061<br />
Manufacturing 34 6% 41,500 57,100 66,000 59,581<br />
Operations 104 19% 49,750 60,000 78,712 65,111<br />
Quality management 39 7% 50,000 62,500 90,000 67,274<br />
Regulatory compliance 62 11% 50,000 62,575 84,000 66,995<br />
Research and development 57 10% 48,500 56,200 66,000 59,514<br />
Supply chain<br />
management/logistics 33 6% 55,000 64,000 90,500 70,652<br />
Other 22 4% 46,000 65,000 80,500 64,707<br />
Annualized Salary by Number of Employees in Entire Organization<br />
Employees n= Percent 25th percentile Median 75th percentile Mean<br />
Fewer than 100 44 8% 50,000 76,500 95,500 76,268<br />
100–299 20 4% 45,500 57,500 80,400 61,759<br />
300– 999 40 7% 42,432 51,000 59,000 51,554<br />
1,000– 2,499 33 6% 40,000 54,500 68,000 59,985<br />
2,500– 4,999 42 7% 50,000 64,500 77,000 67,282<br />
5,000– 9,999 35 6% 45,500 58,750 74,000 61,636<br />
10,000 or more 347 62% 50,000 60,000 72,000 63,525<br />
Annualized Salary by Average Project Team Size<br />
Team size n= Percent 25th percentile Median 75th percentile Mean<br />
1–4 people 62 13% 41,000 54,790 70,000 56,565<br />
5–9 people 142 31% 50,000 60,685 76,000 64,696<br />
10–14 people 88 19% 49,150 58,000 70,500 63,267<br />
15–19 people 41 9% 52,000 62,000 72,000 65,712<br />
20 or more people 132 28% 51,500 62,500 82,092 66,902<br />
Annualized Salary by Average Project Budget (in USD)<br />
Budget n= Percent 25th percentile Median 75th percentile Mean<br />
Less than $100,000 34 6% 44,900 57,899 71,000 57,569<br />
$100,000–$499,999 90 17% 46,844 54,392 65,000 57,492<br />
$500,000–$999,999 94 18% 46,000 57,527 76,000 62,216<br />
$1 million–$10 million 232 44% 50,000 62,250 75,000 65,238<br />
More than $10 million 74 14% 56,200 69,239 85,000 73,387<br />
<strong>Earning</strong> <strong>Power</strong>: Project Management Salary Survey, Ninth Edition<br />
309