

Earning Power
1p4Cz9a
1p4Cz9a

Create successful ePaper yourself
Turn your PDF publications into a flip-book with our unique Google optimized e-Paper software.
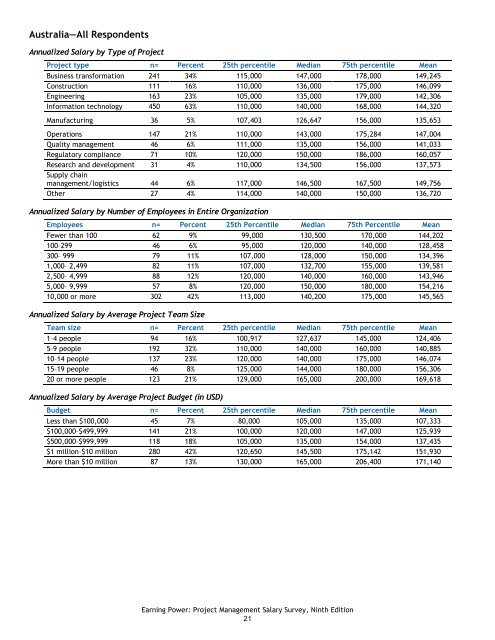
Australia—All Respondents<br />
Annualized Salary by Type of Project<br />
Project type n= Percent 25th percentile Median 75th percentile Mean<br />
Business transformation 241 34% 115,000 147,000 178,000 149,245<br />
Construction 111 16% 110,000 136,000 175,000 146,099<br />
Engineering 163 23% 105,000 135,000 179,000 142,306<br />
Information technology 450 63% 110,000 140,000 168,000 144,320<br />
Manufacturing 36 5% 107,403 126,647 156,000 135,653<br />
Operations 147 21% 110,000 143,000 175,284 147,004<br />
Quality management 46 6% 111,000 135,000 156,000 141,033<br />
Regulatory compliance 71 10% 120,000 150,000 186,000 160,057<br />
Research and development 31 4% 110,000 134,500 156,000 137,573<br />
Supply chain<br />
management/logistics 44 6% 117,000 146,500 167,500 149,756<br />
Other 27 4% 114,000 140,000 150,000 136,720<br />
Annualized Salary by Number of Employees in Entire Organization<br />
Employees n= Percent 25th Percentile Median 75th Percentile Mean<br />
Fewer than 100 62 9% 99,000 130,500 170,000 144,202<br />
100–299 46 6% 95,000 120,000 140,000 128,458<br />
300– 999 79 11% 107,000 128,000 150,000 134,396<br />
1,000– 2,499 82 11% 107,000 132,700 155,000 139,581<br />
2,500– 4,999 88 12% 120,000 140,000 160,000 143,946<br />
5,000– 9,999 57 8% 120,000 150,000 180,000 154,216<br />
10,000 or more 302 42% 113,000 140,200 175,000 145,565<br />
Annualized Salary by Average Project Team Size<br />
Team size n= Percent 25th percentile Median 75th percentile Mean<br />
1–4 people 94 16% 100,917 127,637 145,000 124,406<br />
5–9 people 192 32% 110,000 140,000 160,000 140,885<br />
10–14 people 137 23% 120,000 140,000 175,000 146,074<br />
15–19 people 46 8% 125,000 144,000 180,000 156,306<br />
20 or more people 123 21% 129,000 165,000 200,000 169,618<br />
Annualized Salary by Average Project Budget (in USD)<br />
Budget n= Percent 25th percentile Median 75th percentile Mean<br />
Less than $100,000 45 7% 80,000 105,000 135,000 107,333<br />
$100,000–$499,999 141 21% 100,000 120,000 147,000 125,939<br />
$500,000–$999,999 118 18% 105,000 135,000 154,000 137,435<br />
$1 million–$10 million 280 42% 120,650 145,500 175,142 151,930<br />
More than $10 million 87 13% 130,000 165,000 206,400 171,140<br />
<strong>Earning</strong> <strong>Power</strong>: Project Management Salary Survey, Ninth Edition<br />
21