

Earning Power
1p4Cz9a
1p4Cz9a

Create successful ePaper yourself
Turn your PDF publications into a flip-book with our unique Google optimized e-Paper software.
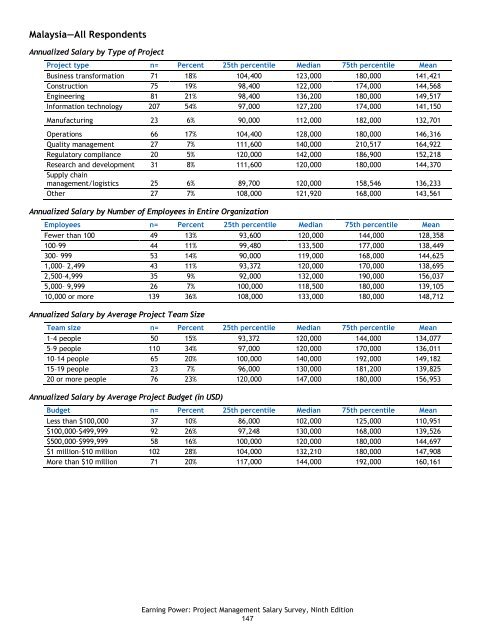
Malaysia—All Respondents<br />
Annualized Salary by Type of Project<br />
Project type n= Percent 25th percentile Median 75th percentile Mean<br />
Business transformation 71 18% 104,400 123,000 180,000 141,421<br />
Construction 75 19% 98,400 122,000 174,000 144,568<br />
Engineering 81 21% 98,400 136,200 180,000 149,517<br />
Information technology 207 54% 97,000 127,200 174,000 141,150<br />
Manufacturing 23 6% 90,000 112,000 182,000 132,701<br />
Operations 66 17% 104,400 128,000 180,000 146,316<br />
Quality management 27 7% 111,600 140,000 210,517 164,922<br />
Regulatory compliance 20 5% 120,000 142,000 186,900 152,218<br />
Research and development 31 8% 111,600 120,000 180,000 144,370<br />
Supply chain<br />
management/logistics 25 6% 89,700 120,000 158,546 136,233<br />
Other 27 7% 108,000 121,920 168,000 143,561<br />
Annualized Salary by Number of Employees in Entire Organization<br />
Employees n= Percent 25th percentile Median 75th percentile Mean<br />
Fewer than 100 49 13% 93,600 120,000 144,000 128,358<br />
100–99 44 11% 99,480 133,500 177,000 138,449<br />
300– 999 53 14% 90,000 119,000 168,000 144,625<br />
1,000– 2,499 43 11% 93,372 120,000 170,000 138,695<br />
2,500–4,999 35 9% 92,000 132,000 190,000 156,037<br />
5,000– 9,999 26 7% 100,000 118,500 180,000 139,105<br />
10,000 or more 139 36% 108,000 133,000 180,000 148,712<br />
Annualized Salary by Average Project Team Size<br />
Team size n= Percent 25th percentile Median 75th percentile Mean<br />
1–4 people 50 15% 93,372 120,000 144,000 134,077<br />
5–9 people 110 34% 97,000 120,000 170,000 136,011<br />
10–14 people 65 20% 100,000 140,000 192,000 149,182<br />
15–19 people 23 7% 96,000 130,000 181,200 139,825<br />
20 or more people 76 23% 120,000 147,000 180,000 156,953<br />
Annualized Salary by Average Project Budget (in USD)<br />
Budget n= Percent 25th percentile Median 75th percentile Mean<br />
Less than $100,000 37 10% 86,000 102,000 125,000 110,951<br />
$100,000–$499,999 92 26% 97,248 130,000 168,000 139,526<br />
$500,000–$999,999 58 16% 100,000 120,000 180,000 144,697<br />
$1 million–$10 million 102 28% 104,000 132,210 180,000 147,908<br />
More than $10 million 71 20% 117,000 144,000 192,000 160,161<br />
<strong>Earning</strong> <strong>Power</strong>: Project Management Salary Survey, Ninth Edition<br />
147