

Earning Power
1p4Cz9a
1p4Cz9a

Create successful ePaper yourself
Turn your PDF publications into a flip-book with our unique Google optimized e-Paper software.
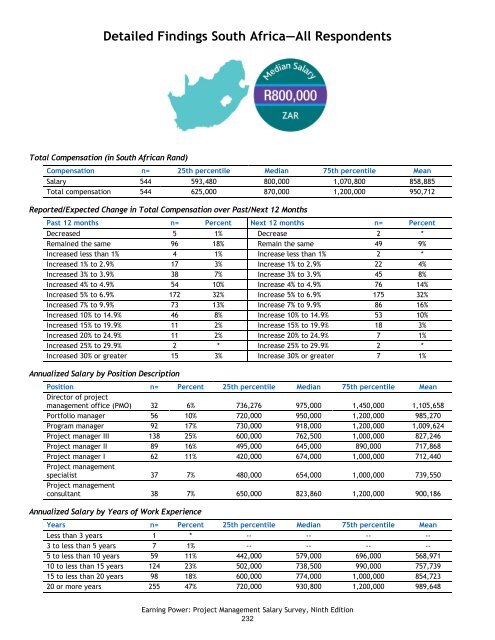
Detailed Findings South Africa—All Respondents<br />
Total Compensation (in South African Rand)<br />
Compensation n= 25th percentile Median 75th percentile Mean<br />
Salary 544 593,480 800,000 1,070,800 858,885<br />
Total compensation 544 625,000 870,000 1,200,000 950,712<br />
Reported/Expected Change in Total Compensation over Past/Next 12 Months<br />
Past 12 months n= Percent Next 12 months n= Percent<br />
Decreased 5 1% Decrease 2 *<br />
Remained the same 96 18% Remain the same 49 9%<br />
Increased less than 1% 4 1% Increase less than 1% 2 *<br />
Increased 1% to 2.9% 17 3% Increase 1% to 2.9% 22 4%<br />
Increased 3% to 3.9% 38 7% Increase 3% to 3.9% 45 8%<br />
Increased 4% to 4.9% 54 10% Increase 4% to 4.9% 76 14%<br />
Increased 5% to 6.9% 172 32% Increase 5% to 6.9% 175 32%<br />
Increased 7% to 9.9% 73 13% Increase 7% to 9.9% 86 16%<br />
Increased 10% to 14.9% 46 8% Increase 10% to 14.9% 53 10%<br />
Increased 15% to 19.9% 11 2% Increase 15% to 19.9% 18 3%<br />
Increased 20% to 24.9% 11 2% Increase 20% to 24.9% 7 1%<br />
Increased 25% to 29.9% 2 * Increase 25% to 29.9% 2 *<br />
Increased 30% or greater 15 3% Increase 30% or greater 7 1%<br />
Annualized Salary by Position Description<br />
Position n= Percent 25th percentile Median 75th percentile Mean<br />
Director of project<br />
management office (PMO) 32 6% 736,276 975,000 1,450,000 1,105,658<br />
Portfolio manager 56 10% 720,000 950,000 1,200,000 985,270<br />
Program manager 92 17% 730,000 918,000 1,200,000 1,009,624<br />
Project manager III 138 25% 600,000 762,500 1,000,000 827,246<br />
Project manager II 89 16% 495,000 645,000 890,000 717,868<br />
Project manager I 62 11% 420,000 674,000 1,000,000 712,440<br />
Project management<br />
specialist 37 7% 480,000 654,000 1,000,000 739,550<br />
Project management<br />
consultant 38 7% 650,000 823,860 1,200,000 900,186<br />
Annualized Salary by Years of Work Experience<br />
Years n= Percent 25th percentile Median 75th percentile Mean<br />
Less than 3 years 1 * -- -- -- --<br />
3 to less than 5 years 7 1% -- -- -- --<br />
5 to less than 10 years 59 11% 442,000 579,000 696,000 568,971<br />
10 to less than 15 years 124 23% 502,000 738,500 990,000 757,739<br />
15 to less than 20 years 98 18% 600,000 774,000 1,000,000 854,723<br />
20 or more years 255 47% 720,000 930,800 1,200,000 989,648<br />
<strong>Earning</strong> <strong>Power</strong>: Project Management Salary Survey, Ninth Edition<br />
232