

Earning Power
1p4Cz9a
1p4Cz9a

You also want an ePaper? Increase the reach of your titles
YUMPU automatically turns print PDFs into web optimized ePapers that Google loves.
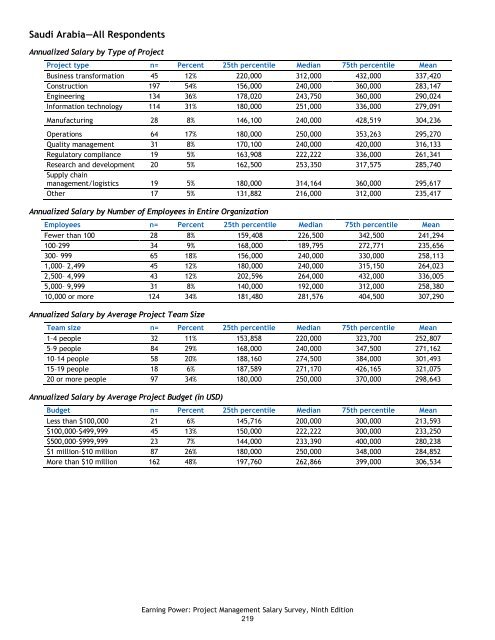
Saudi Arabia—All Respondents<br />
Annualized Salary by Type of Project<br />
Project type n= Percent 25th percentile Median 75th percentile Mean<br />
Business transformation 45 12% 220,000 312,000 432,000 337,420<br />
Construction 197 54% 156,000 240,000 360,000 283,147<br />
Engineering 134 36% 178,020 243,750 360,000 290,024<br />
Information technology 114 31% 180,000 251,000 336,000 279,091<br />
Manufacturing 28 8% 146,100 240,000 428,519 304,236<br />
Operations 64 17% 180,000 250,000 353,263 295,270<br />
Quality management 31 8% 170,100 240,000 420,000 316,133<br />
Regulatory compliance 19 5% 163,908 222,222 336,000 261,341<br />
Research and development 20 5% 162,500 253,350 317,575 285,740<br />
Supply chain<br />
management/logistics 19 5% 180,000 314,164 360,000 295,617<br />
Other 17 5% 131,882 216,000 312,000 235,417<br />
Annualized Salary by Number of Employees in Entire Organization<br />
Employees n= Percent 25th percentile Median 75th percentile Mean<br />
Fewer than 100 28 8% 159,408 226,500 342,500 241,294<br />
100–299 34 9% 168,000 189,795 272,771 235,656<br />
300– 999 65 18% 156,000 240,000 330,000 258,113<br />
1,000– 2,499 45 12% 180,000 240,000 315,150 264,023<br />
2,500– 4,999 43 12% 202,596 264,000 432,000 336,005<br />
5,000– 9,999 31 8% 140,000 192,000 312,000 258,380<br />
10,000 or more 124 34% 181,480 281,576 404,500 307,290<br />
Annualized Salary by Average Project Team Size<br />
Team size n= Percent 25th percentile Median 75th percentile Mean<br />
1–4 people 32 11% 153,858 220,000 323,700 252,807<br />
5–9 people 84 29% 168,000 240,000 347,500 271,162<br />
10–14 people 58 20% 188,160 274,500 384,000 301,493<br />
15–19 people 18 6% 187,589 271,170 426,165 321,075<br />
20 or more people 97 34% 180,000 250,000 370,000 298,643<br />
Annualized Salary by Average Project Budget (in USD)<br />
Budget n= Percent 25th percentile Median 75th percentile Mean<br />
Less than $100,000 21 6% 145,716 200,000 300,000 213,593<br />
$100,000–$499,999 45 13% 150,000 222,222 300,000 233,250<br />
$500,000–$999,999 23 7% 144,000 233,390 400,000 280,238<br />
$1 million–$10 million 87 26% 180,000 250,000 348,000 284,852<br />
More than $10 million 162 48% 197,760 262,866 399,000 306,534<br />
<strong>Earning</strong> <strong>Power</strong>: Project Management Salary Survey, Ninth Edition<br />
219