

Earning Power
1p4Cz9a
1p4Cz9a

Create successful ePaper yourself
Turn your PDF publications into a flip-book with our unique Google optimized e-Paper software.
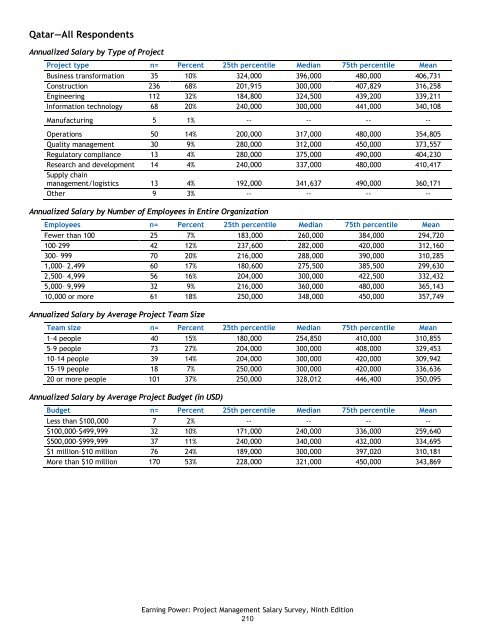
Qatar—All Respondents<br />
Annualized Salary by Type of Project<br />
Project type n= Percent 25th percentile Median 75th percentile Mean<br />
Business transformation 35 10% 324,000 396,000 480,000 406,731<br />
Construction 236 68% 201,915 300,000 407,829 316,258<br />
Engineering 112 32% 184,800 324,500 439,200 339,211<br />
Information technology 68 20% 240,000 300,000 441,000 340,108<br />
Manufacturing 5 1% -- -- -- --<br />
Operations 50 14% 200,000 317,000 480,000 354,805<br />
Quality management 30 9% 280,000 312,000 450,000 373,557<br />
Regulatory compliance 13 4% 280,000 375,000 490,000 404,230<br />
Research and development 14 4% 240,000 337,000 480,000 410,417<br />
Supply chain<br />
management/logistics 13 4% 192,000 341,637 490,000 360,171<br />
Other 9 3% -- -- -- --<br />
Annualized Salary by Number of Employees in Entire Organization<br />
Employees n= Percent 25th percentile Median 75th percentile Mean<br />
Fewer than 100 25 7% 183,000 260,000 384,000 294,720<br />
100–299 42 12% 237,600 282,000 420,000 312,160<br />
300– 999 70 20% 216,000 288,000 390,000 310,285<br />
1,000– 2,499 60 17% 180,600 275,500 385,500 299,630<br />
2,500– 4,999 56 16% 204,000 300,000 422,500 332,432<br />
5,000– 9,999 32 9% 216,000 360,000 480,000 365,143<br />
10,000 or more 61 18% 250,000 348,000 450,000 357,749<br />
Annualized Salary by Average Project Team Size<br />
Team size n= Percent 25th percentile Median 75th percentile Mean<br />
1–4 people 40 15% 180,000 254,850 410,000 310,855<br />
5–9 people 73 27% 204,000 300,000 408,000 329,453<br />
10–14 people 39 14% 204,000 300,000 420,000 309,942<br />
15–19 people 18 7% 250,000 300,000 420,000 336,636<br />
20 or more people 101 37% 250,000 328,012 446,400 350,095<br />
Annualized Salary by Average Project Budget (in USD)<br />
Budget n= Percent 25th percentile Median 75th percentile Mean<br />
Less than $100,000 7 2% -- -- -- --<br />
$100,000–$499,999 32 10% 171,000 240,000 336,000 259,640<br />
$500,000–$999,999 37 11% 240,000 340,000 432,000 334,695<br />
$1 million–$10 million 76 24% 189,000 300,000 397,020 310,181<br />
More than $10 million 170 53% 228,000 321,000 450,000 343,869<br />
<strong>Earning</strong> <strong>Power</strong>: Project Management Salary Survey, Ninth Edition<br />
210