

Earning Power
1p4Cz9a
1p4Cz9a

You also want an ePaper? Increase the reach of your titles
YUMPU automatically turns print PDFs into web optimized ePapers that Google loves.
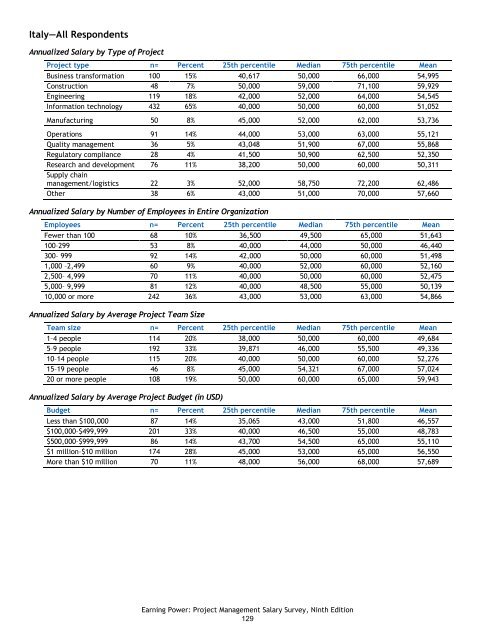
Italy—All Respondents<br />
Annualized Salary by Type of Project<br />
Project type n= Percent 25th percentile Median 75th percentile Mean<br />
Business transformation 100 15% 40,617 50,000 66,000 54,995<br />
Construction 48 7% 50,000 59,000 71,100 59,929<br />
Engineering 119 18% 42,000 52,000 64,000 54,545<br />
Information technology 432 65% 40,000 50,000 60,000 51,052<br />
Manufacturing 50 8% 45,000 52,000 62,000 53,736<br />
Operations 91 14% 44,000 53,000 63,000 55,121<br />
Quality management 36 5% 43,048 51,900 67,000 55,868<br />
Regulatory compliance 28 4% 41,500 50,900 62,500 52,350<br />
Research and development 76 11% 38,200 50,000 60,000 50,311<br />
Supply chain<br />
management/logistics 22 3% 52,000 58,750 72,200 62,486<br />
Other 38 6% 43,000 51,000 70,000 57,660<br />
Annualized Salary by Number of Employees in Entire Organization<br />
Employees n= Percent 25th percentile Median 75th percentile Mean<br />
Fewer than 100 68 10% 36,500 49,500 65,000 51,643<br />
100–299 53 8% 40,000 44,000 50,000 46,440<br />
300– 999 92 14% 42,000 50,000 60,000 51,498<br />
1,000 –2,499 60 9% 40,000 52,000 60,000 52,160<br />
2,500– 4,999 70 11% 40,000 50,000 60,000 52,475<br />
5,000– 9,999 81 12% 40,000 48,500 55,000 50,139<br />
10,000 or more 242 36% 43,000 53,000 63,000 54,866<br />
Annualized Salary by Average Project Team Size<br />
Team size n= Percent 25th percentile Median 75th percentile Mean<br />
1–4 people 114 20% 38,000 50,000 60,000 49,684<br />
5–9 people 192 33% 39,871 46,000 55,500 49,336<br />
10–14 people 115 20% 40,000 50,000 60,000 52,276<br />
15–19 people 46 8% 45,000 54,321 67,000 57,024<br />
20 or more people 108 19% 50,000 60,000 65,000 59,943<br />
Annualized Salary by Average Project Budget (in USD)<br />
Budget n= Percent 25th percentile Median 75th percentile Mean<br />
Less than $100,000 87 14% 35,065 43,000 51,800 46,557<br />
$100,000–$499,999 201 33% 40,000 46,500 55,000 48,783<br />
$500,000–$999,999 86 14% 43,700 54,500 65,000 55,110<br />
$1 million–$10 million 174 28% 45,000 53,000 65,000 56,550<br />
More than $10 million 70 11% 48,000 56,000 68,000 57,689<br />
<strong>Earning</strong> <strong>Power</strong>: Project Management Salary Survey, Ninth Edition<br />
129