

Earning Power
1p4Cz9a
1p4Cz9a

You also want an ePaper? Increase the reach of your titles
YUMPU automatically turns print PDFs into web optimized ePapers that Google loves.
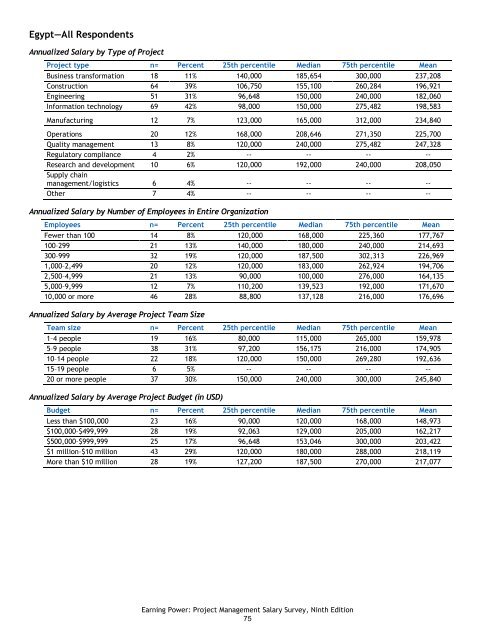
Egypt—All Respondents<br />
Annualized Salary by Type of Project<br />
Project type n= Percent 25th percentile Median 75th percentile Mean<br />
Business transformation 18 11% 140,000 185,654 300,000 237,208<br />
Construction 64 39% 106,750 155,100 260,284 196,921<br />
Engineering 51 31% 96,648 150,000 240,000 182,060<br />
Information technology 69 42% 98,000 150,000 275,482 198,583<br />
Manufacturing 12 7% 123,000 165,000 312,000 234,840<br />
Operations 20 12% 168,000 208,646 271,350 225,700<br />
Quality management 13 8% 120,000 240,000 275,482 247,328<br />
Regulatory compliance 4 2% -- -- -- --<br />
Research and development 10 6% 120,000 192,000 240,000 208,050<br />
Supply chain<br />
management/logistics 6 4% -- -- -- --<br />
Other 7 4% -- -- -- --<br />
Annualized Salary by Number of Employees in Entire Organization<br />
Employees n= Percent 25th percentile Median 75th percentile Mean<br />
Fewer than 100 14 8% 120,000 168,000 225,360 177,767<br />
100–299 21 13% 140,000 180,000 240,000 214,693<br />
300–999 32 19% 120,000 187,500 302,313 226,969<br />
1,000–2,499 20 12% 120,000 183,000 262,924 194,706<br />
2,500–4,999 21 13% 90,000 100,000 276,000 164,135<br />
5,000–9,999 12 7% 110,200 139,523 192,000 171,670<br />
10,000 or more 46 28% 88,800 137,128 216,000 176,696<br />
Annualized Salary by Average Project Team Size<br />
Team size n= Percent 25th percentile Median 75th percentile Mean<br />
1–4 people 19 16% 80,000 115,000 265,000 159,978<br />
5–9 people 38 31% 97,200 156,175 216,000 174,905<br />
10–14 people 22 18% 120,000 150,000 269,280 192,636<br />
15–19 people 6 5% -- -- -- --<br />
20 or more people 37 30% 150,000 240,000 300,000 245,840<br />
Annualized Salary by Average Project Budget (in USD)<br />
Budget n= Percent 25th percentile Median 75th percentile Mean<br />
Less than $100,000 23 16% 90,000 120,000 168,000 148,973<br />
$100,000–$499,999 28 19% 92,063 129,000 205,000 162,217<br />
$500,000–$999,999 25 17% 96,648 153,046 300,000 203,422<br />
$1 million–$10 million 43 29% 120,000 180,000 288,000 218,119<br />
More than $10 million 28 19% 127,200 187,500 270,000 217,077<br />
<strong>Earning</strong> <strong>Power</strong>: Project Management Salary Survey, Ninth Edition<br />
75