South Africa—All Respondents Annualized Salary by Highest Formal Education Level Obtained Education n= Percent 25th percentile Median 75th percentile Mean High school degree 28 5% 350,000 550,592 1,034,000 694,878 Some college or associate’s degree 129 24% 520,000 710,000 1,000,000 781,749 4-year college degree 242 44% 600,000 786,484 1,000,000 828,303 Master’s degree 128 24% 720,000 949,500 1,200,000 997,514 Doctoral degree 17 3% 730,000 1,000,000 1,500,000 1,105,895 Annualized Salary by Degree in Project Management Degree n= Percent 25th percentile Median 75th percentile Mean Have a degree in PM 130 24% 600,000 813,317 1,050,000 858,305 No degree in PM 411 76% 582,000 800,000 1,071,600 858,525 Annualized Salary by PMP ® Status Status n= Percent 25th percentile Median 75th percentile Mean Have a PMP ® certification 421 77% 650,000 850,000 1,100,000 913,771 PMP for less than 1 year 7 2% -- -- -- -- PMP for 1 to less than 5 years 247 59% 585,000 750,000 1,000,000 826,899 PMP for 5 to less than 10 years 111 27% 800,000 944,330 1,129,146 992,019 PMP for 10 to less than 20 years 50 12% 930,800 1,200,000 1,473,400 1,196,460 PMP for 20 or more years 1 * -- -- -- -- Do not have a PMP ® certification 123 23% 385,000 578,000 900,000 671,022 Annualized Salary by Amount of Training per Year Days n= Percent 25th percentile Median 75th percentile Mean Less than 5 days 209 39% 570,000 800,000 1,090,000 855,628 5 to 9 days 160 30% 604,300 844,500 1,061,300 877,722 10 days or more 173 32% 579,000 787,500 1,010,000 844,586 Annualized Salary by Gender Gender n= Percent 25th percentile Median 75th percentile Mean Male 388 74% 654,500 877,500 1,147,238 923,736 Female 138 26% 450,000 612,500 807,720 659,778 <strong>Earning</strong> <strong>Power</strong>: Project Management Salary Survey, Ninth Edition 235
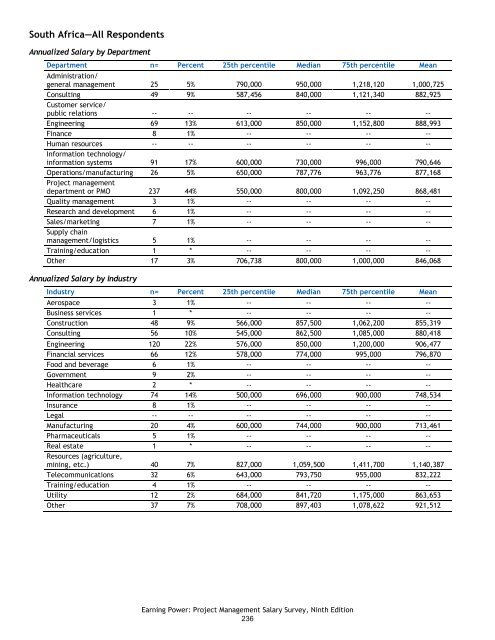
South Africa—All Respondents Annualized Salary by Department Department n= Percent 25th percentile Median 75th percentile Mean Administration/ general management 25 5% 790,000 950,000 1,218,120 1,000,725 Consulting 49 9% 587,456 840,000 1,121,340 882,925 Customer service/ public relations -- -- -- -- -- -- Engineering 69 13% 613,000 850,000 1,152,800 888,993 Finance 8 1% -- -- -- -- Human resources -- -- -- -- -- -- Information technology/ information systems 91 17% 600,000 730,000 996,000 790,646 Operations/manufacturing 26 5% 650,000 787,776 963,776 877,168 Project management department or PMO 237 44% 550,000 800,000 1,092,250 868,481 Quality management 3 1% -- -- -- -- Research and development 6 1% -- -- -- -- Sales/marketing 7 1% -- -- -- -- Supply chain management/logistics 5 1% -- -- -- -- Training/education 1 * -- -- -- -- Other 17 3% 706,738 800,000 1,000,000 846,068 Annualized Salary by Industry Industry n= Percent 25th percentile Median 75th percentile Mean Aerospace 3 1% -- -- -- -- Business services 1 * -- -- -- -- Construction 48 9% 566,000 857,500 1,062,200 855,319 Consulting 56 10% 545,000 862,500 1,085,000 880,418 Engineering 120 22% 576,000 850,000 1,200,000 906,477 Financial services 66 12% 578,000 774,000 995,000 796,870 Food and beverage 6 1% -- -- -- -- Government 9 2% -- -- -- -- Healthcare 2 * -- -- -- -- Information technology 74 14% 500,000 696,000 900,000 748,534 Insurance 8 1% -- -- -- -- Legal -- -- -- -- -- -- Manufacturing 20 4% 600,000 744,000 900,000 713,461 Pharmaceuticals 5 1% -- -- -- -- Real estate 1 * -- -- -- -- Resources (agriculture, mining, etc.) 40 7% 827,000 1,059,500 1,411,700 1,140,387 Telecommunications 32 6% 643,000 793,750 955,000 832,222 Training/education 4 1% -- -- -- -- Utility 12 2% 684,000 841,720 1,175,000 863,653 Other 37 7% 708,000 897,403 1,078,622 921,512 <strong>Earning</strong> <strong>Power</strong>: Project Management Salary Survey, Ninth Edition 236
- Page 1 and 2:
Earning Power Project Management Sa
- Page 3 and 4:
Earning Power: Project Management S
- Page 5 and 6:
Detailed Findings Singapore—All R
- Page 7 and 8:
About PMI Project Management Instit
- Page 9 and 10:
Reporting of Compensation Data Alth
- Page 11 and 12:
Country of Employment As seen in th
- Page 13 and 14:
PMP ® Certification Status The maj
- Page 15 and 16:
Project Size The size of projects m
- Page 17 and 18:
Detailed Findings Australia—All R
- Page 19 and 20:
Australia—All Respondents Annuali
- Page 21 and 22:
Australia—All Respondents Annuali
- Page 23 and 24:
Australia—All Respondents Project
- Page 25 and 26:
Australia—All Respondents Annuali
- Page 27 and 28:
Belgium—All Respondents Annualize
- Page 29 and 30:
Belgium—All Respondents Annualize
- Page 31 and 32:
Belgium—All Respondents Annualize
- Page 33 and 34:
Belgium—All Respondents Mean Numb
- Page 35 and 36:
Detailed Findings Brazil—All Resp
- Page 37 and 38:
Brazil—All Respondents Annualized
- Page 39 and 40:
Brazil—All Respondents Annualized
- Page 41 and 42:
Brazil—All Respondents Project Ma
- Page 43 and 44:
Brazil—All Respondents Annualized
- Page 45 and 46:
Canada—All Respondents Annualized
- Page 47 and 48:
Canada—All Respondents Annualized
- Page 49 and 50:
Canada—All Respondents Annualized
- Page 51 and 52:
Canada—All Respondents Mean Numbe
- Page 53 and 54:
Detailed Findings China—All Respo
- Page 55 and 56:
China—All Respondents Annualized
- Page 57 and 58:
China—All Respondents Annualized
- Page 59 and 60:
China—All Respondents Project Man
- Page 61 and 62:
China—All Respondents Annualized
- Page 63 and 64:
Colombia—All Respondents Annualiz
- Page 65 and 66:
Colombia—All Respondents Annualiz
- Page 67 and 68:
Colombia—All Respondents Annualiz
- Page 69 and 70:
Colombia—All Respondents Mean Num
- Page 71 and 72:
Detailed Findings Egypt—All Respo
- Page 73 and 74:
Egypt—All Respondents Annualized
- Page 75 and 76:
Egypt—All Respondents Annualized
- Page 77 and 78:
Egypt—All Respondents Project Man
- Page 79 and 80:
Egypt—All Respondents Annualized
- Page 81 and 82:
France—All Respondents Annualized
- Page 83 and 84:
France—All Respondents Annualized
- Page 85 and 86:
France—All Respondents Annualized
- Page 87 and 88:
France—All Respondents Mean Numbe
- Page 89 and 90:
Detailed Findings Germany—All Res
- Page 91 and 92:
Germany—All Respondents Annualize
- Page 93 and 94:
Germany—All Respondents Annualize
- Page 95 and 96:
Germany—All Respondents Project M
- Page 97 and 98:
Germany—All Respondents Annualize
- Page 99 and 100:
Hong Kong—All Respondents Annuali
- Page 101 and 102:
Hong Kong—All Respondents Annuali
- Page 103 and 104:
Hong Kong—All Respondents Annuali
- Page 105 and 106:
Hong Kong—All Respondents Mean Nu
- Page 107 and 108:
Detailed Findings India—All Respo
- Page 109 and 110:
India—All Respondents Annualized
- Page 111 and 112:
India—All Respondents Annualized
- Page 113 and 114:
India—All Respondents Project Man
- Page 115 and 116:
India—All Respondents Annualized
- Page 117 and 118:
Ireland—All Respondents Annualize
- Page 119 and 120:
Ireland—All Respondents Annualize
- Page 121 and 122:
Ireland—All Respondents Annualize
- Page 123 and 124:
Ireland—All Respondents Mean Numb
- Page 125 and 126:
Detailed Findings Italy—All Respo
- Page 127 and 128:
Italy—All Respondents Annualized
- Page 129 and 130:
Italy—All Respondents Annualized
- Page 131 and 132:
Italy—All Respondents Project Man
- Page 133 and 134:
Italy—All Respondents Annualized
- Page 135 and 136:
Japan—All Respondents Annualized
- Page 137 and 138:
Japan—All Respondents Annualized
- Page 139 and 140:
Japan—All Respondents Annualized
- Page 141 and 142:
Japan—All Respondents Mean Number
- Page 143 and 144:
Detailed Findings Malaysia—All Re
- Page 145 and 146:
Malaysia—All Respondents Annualiz
- Page 147 and 148:
Malaysia—All Respondents Annualiz
- Page 149 and 150:
Malaysia—All Respondents Project
- Page 151 and 152:
Malaysia—All Respondents Annualiz
- Page 153 and 154:
Mexico—All Respondents Annualized
- Page 155 and 156:
Mexico—All Respondents Annualized
- Page 157 and 158:
Mexico—All Respondents Annualized
- Page 159 and 160:
Mexico—All Respondents Mean Numbe
- Page 161 and 162:
Detailed Findings Netherlands—All
- Page 163 and 164:
Netherlands—All Respondents Annua
- Page 165 and 166:
Netherlands—All Respondents Annua
- Page 167 and 168:
Netherlands—All Respondents Proje
- Page 169 and 170:
Netherlands—All Respondents Annua
- Page 171 and 172:
New Zealand—All Respondents Annua
- Page 173 and 174:
New Zealand—All Respondents Annua
- Page 175 and 176:
New Zealand—All Respondents Annua
- Page 177 and 178:
New Zealand—All Respondents Mean
- Page 179 and 180:
Detailed Findings Nigeria—All Res
- Page 181 and 182:
Nigeria—All Respondents Annualize
- Page 183 and 184:
Nigeria—All Respondents Annualize
- Page 185 and 186: Nigeria—All Respondents Project M
- Page 187 and 188: Nigeria—All Respondents Annualize
- Page 189 and 190: Peru—All Respondents Annualized S
- Page 191 and 192: Peru—All Respondents Annualized S
- Page 193 and 194: Peru—All Respondents Annualized S
- Page 195 and 196: Peru—All Respondents Mean Number
- Page 197 and 198: Detailed Findings Poland—All Resp
- Page 199 and 200: Poland—All Respondents Annualized
- Page 201 and 202: Poland—All Respondents Annualized
- Page 203 and 204: Poland—All Respondents Project Ma
- Page 205 and 206: Poland—All Respondents Annualized
- Page 207 and 208: Qatar—All Respondents Annualized
- Page 209 and 210: Qatar—All Respondents Annualized
- Page 211 and 212: Qatar—All Respondents Annualized
- Page 213 and 214: Qatar—All Respondents Mean Number
- Page 215 and 216: Detailed Findings Saudi Arabia—Al
- Page 217 and 218: Saudi Arabia—All Respondents Annu
- Page 219 and 220: Saudi Arabia—All Respondents Annu
- Page 221 and 222: Saudi Arabia—All Respondents Proj
- Page 223 and 224: Saudi Arabia—All Respondents Annu
- Page 225 and 226: Singapore—All Respondents Annuali
- Page 227 and 228: Singapore—All Respondents Annuali
- Page 229 and 230: Singapore—All Respondents Annuali
- Page 231 and 232: Singapore—All Respondents Mean Nu
- Page 233 and 234: Detailed Findings South Africa—Al
- Page 235: South Africa—All Respondents Annu
- Page 239 and 240: South Africa—All Respondents Proj
- Page 241 and 242: South Africa—All Respondents Annu
- Page 243 and 244: South Korea—All Respondents Annua
- Page 245 and 246: South Korea—All Respondents Annua
- Page 247 and 248: South Korea—All Respondents Annua
- Page 249 and 250: South Korea—All Respondents Mean
- Page 251 and 252: Detailed Findings Spain—All Respo
- Page 253 and 254: Spain—All Respondents Annualized
- Page 255 and 256: Spain—All Respondents Annualized
- Page 257 and 258: Spain—All Respondents Project Man
- Page 259 and 260: Spain—All Respondents Annualized
- Page 261 and 262: Sweden—All Respondents Annualized
- Page 263 and 264: Sweden—All Respondents Annualized
- Page 265 and 266: Sweden—All Respondents Annualized
- Page 267 and 268: Sweden—All Respondents Mean Numbe
- Page 269 and 270: Detailed Findings Switzerland—All
- Page 271 and 272: Switzerland—All Respondents Annua
- Page 273 and 274: Switzerland—All Respondents Annua
- Page 275 and 276: Switzerland—All Respondents Proje
- Page 277 and 278: Switzerland—All Respondents Annua
- Page 279 and 280: Taiwan—All Respondents Annualized
- Page 281 and 282: Taiwan—All Respondents Annualized
- Page 283 and 284: Taiwan—All Respondents Annualized
- Page 285 and 286: Taiwan—All Respondents Mean Numbe
- Page 287 and 288:
Detailed Findings Turkey—All Resp
- Page 289 and 290:
Turkey—All Respondents Annualized
- Page 291 and 292:
Turkey—All Respondents Annualized
- Page 293 and 294:
Turkey—All Respondents Project Ma
- Page 295 and 296:
Turkey—All Respondents Annualized
- Page 297 and 298:
United Arab Emirates—All Responde
- Page 299 and 300:
United Arab Emirates—All Responde
- Page 301 and 302:
United Arab Emirates—All Responde
- Page 303 and 304:
United Arab Emirates—All Responde
- Page 305 and 306:
Detailed Findings United Kingdom—
- Page 307 and 308:
United Kingdom—All Respondents An
- Page 309 and 310:
United Kingdom—All Respondents An
- Page 311 and 312:
United Kingdom—All Respondents Pr
- Page 313 and 314:
United Kingdom—All Respondents An
- Page 315 and 316:
United States—All Respondents Ann
- Page 317 and 318:
United States—All Respondents Ann
- Page 319 and 320:
United States—All Respondents Ann
- Page 321 and 322:
United States—All Respondents Mea
- Page 323 and 324:
Years of Work Experience Appendix A
- Page 325 and 326:
Years of Technique Experience Agile
- Page 327 and 328:
Years of Technique Experience (Cont
- Page 329 and 330:
Years of Technique Experience (Cont
- Page 331 and 332:
Years of Technique Experience (Cont
- Page 333 and 334:
Degree in Project Management Countr
- Page 335 and 336:
Training Received Over Past 12 Mont
- Page 337 and 338:
Functional Area Country n= Admin/ g
- Page 339 and 340:
Type of Project Country n= Business
- Page 341 and 342:
Position Description Country n= Dir
- Page 343 and 344:
Employees Within Entire Organizatio
- Page 345 and 346:
Average Budget of Projects Country
- Page 347 and 348:
How do you expect your total compen
- Page 349 and 350:
Project Management Career Path Conn
- Page 351 and 352:
Equities Offered Country n= Stock o
- Page 353 and 354:
Mean Number of Vacation Days Countr
- Page 355 and 356:
Mean Hours Worked Country n= Hours
- Page 357 and 358:
(IF COUNTRY IS US, ASK:) 3) Please
- Page 359 and 360:
If you selected a certification fro
- Page 361 and 362:
the ROI from these projects and ens
- Page 363 and 364:
GUIDELINES FOR REPORTING COMPENSATI
- Page 365 and 366:
28) How has your total compensation
- Page 367 and 368:
(If there is a Career Path, ASK:) 4
- Page 369 and 370:
Appendix C—Sampling Methodology P
- Page 371:
Appendix D—Exchange Rates Currenc