

Earning Power
1p4Cz9a
1p4Cz9a

You also want an ePaper? Increase the reach of your titles
YUMPU automatically turns print PDFs into web optimized ePapers that Google loves.
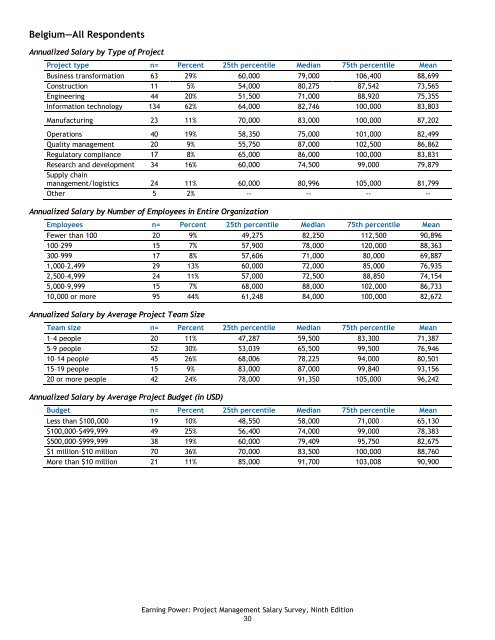
Belgium—All Respondents<br />
Annualized Salary by Type of Project<br />
Project type n= Percent 25th percentile Median 75th percentile Mean<br />
Business transformation 63 29% 60,000 79,000 106,400 88,699<br />
Construction 11 5% 54,000 80,275 87,542 73,565<br />
Engineering 44 20% 51,500 71,000 88,920 75,355<br />
Information technology 134 62% 64,000 82,746 100,000 83,803<br />
Manufacturing 23 11% 70,000 83,000 100,000 87,202<br />
Operations 40 19% 58,350 75,000 101,000 82,499<br />
Quality management 20 9% 55,750 87,000 102,500 86,862<br />
Regulatory compliance 17 8% 65,000 86,000 100,000 83,831<br />
Research and development 34 16% 60,000 74,500 99,000 79,879<br />
Supply chain<br />
management/logistics 24 11% 60,000 80,996 105,000 81,799<br />
Other 5 2% -- -- -- --<br />
Annualized Salary by Number of Employees in Entire Organization<br />
Employees n= Percent 25th percentile Median 75th percentile Mean<br />
Fewer than 100 20 9% 49,275 82,250 112,500 90,896<br />
100–299 15 7% 57,900 78,000 120,000 88,363<br />
300–999 17 8% 57,606 71,000 80,000 69,887<br />
1,000–2,499 29 13% 60,000 72,000 85,000 76,935<br />
2,500–4,999 24 11% 57,000 72,500 88,850 74,154<br />
5,000–9,999 15 7% 68,000 88,000 102,000 86,733<br />
10,000 or more 95 44% 61,248 84,000 100,000 82,672<br />
Annualized Salary by Average Project Team Size<br />
Team size n= Percent 25th percentile Median 75th percentile Mean<br />
1–4 people 20 11% 47,287 59,500 83,300 71,387<br />
5–9 people 52 30% 53,039 65,500 99,500 76,946<br />
10–14 people 45 26% 68,006 78,225 94,000 80,501<br />
15–19 people 15 9% 83,000 87,000 99,840 93,156<br />
20 or more people 42 24% 78,000 91,350 105,000 96,242<br />
Annualized Salary by Average Project Budget (in USD)<br />
Budget n= Percent 25th percentile Median 75th percentile Mean<br />
Less than $100,000 19 10% 48,550 58,000 71,000 65,130<br />
$100,000–$499,999 49 25% 56,400 74,000 99,000 78,383<br />
$500,000–$999,999 38 19% 60,000 79,409 95,750 82,675<br />
$1 million–$10 million 70 36% 70,000 83,500 100,000 88,760<br />
More than $10 million 21 11% 85,000 91,700 103,008 90,900<br />
<strong>Earning</strong> <strong>Power</strong>: Project Management Salary Survey, Ninth Edition<br />
30