

Materials for engineering, 3rd Edition - (Malestrom)

Create successful ePaper yourself
Turn your PDF publications into a flip-book with our unique Google optimized e-Paper software.
16<br />
<strong>Materials</strong> <strong>for</strong> <strong>engineering</strong><br />
1600<br />
C<br />
1500<br />
Liquid (L)<br />
Temperature (°C)<br />
1400<br />
1300<br />
1200<br />
L + S<br />
e<br />
d<br />
b<br />
x<br />
a<br />
T 1<br />
T 2<br />
T 3<br />
1100<br />
Solid solution (S)<br />
1000<br />
0 10 20 30 40 50 60 C 70 80 90 100<br />
Weight<br />
(%Ni)<br />
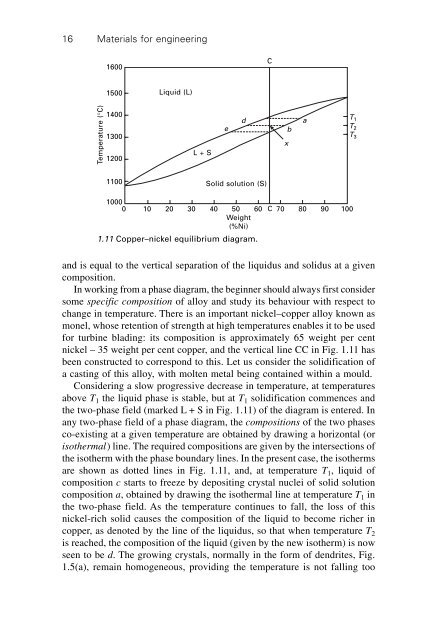
1.11 Copper–nickel equilibrium diagram.<br />
and is equal to the vertical separation of the liquidus and solidus at a given<br />
composition.<br />
In working from a phase diagram, the beginner should always first consider<br />
some specific composition of alloy and study its behaviour with respect to<br />
change in temperature. There is an important nickel–copper alloy known as<br />
monel, whose retention of strength at high temperatures enables it to be used<br />
<strong>for</strong> turbine blading: its composition is approximately 65 weight per cent<br />
nickel – 35 weight per cent copper, and the vertical line CC in Fig. 1.11 has<br />
been constructed to correspond to this. Let us consider the solidification of<br />
a casting of this alloy, with molten metal being contained within a mould.<br />
Considering a slow progressive decrease in temperature, at temperatures<br />
above T 1 the liquid phase is stable, but at T 1 solidification commences and<br />
the two-phase field (marked L + S in Fig. 1.11) of the diagram is entered. In<br />
any two-phase field of a phase diagram, the compositions of the two phases<br />
co-existing at a given temperature are obtained by drawing a horizontal (or<br />
isothermal) line. The required compositions are given by the intersections of<br />
the isotherm with the phase boundary lines. In the present case, the isotherms<br />
are shown as dotted lines in Fig. 1.11, and, at temperature T 1 , liquid of<br />
composition c starts to freeze by depositing crystal nuclei of solid solution<br />
composition a, obtained by drawing the isothermal line at temperature T 1 in<br />
the two-phase field. As the temperature continues to fall, the loss of this<br />
nickel-rich solid causes the composition of the liquid to become richer in<br />
copper, as denoted by the line of the liquidus, so that when temperature T 2<br />
is reached, the composition of the liquid (given by the new isotherm) is now<br />
seen to be d. The growing crystals, normally in the <strong>for</strong>m of dendrites, Fig.<br />
1.5(a), remain homogeneous, providing the temperature is not falling too