
You also want an ePaper? Increase the reach of your titles
YUMPU automatically turns print PDFs into web optimized ePapers that Google loves.
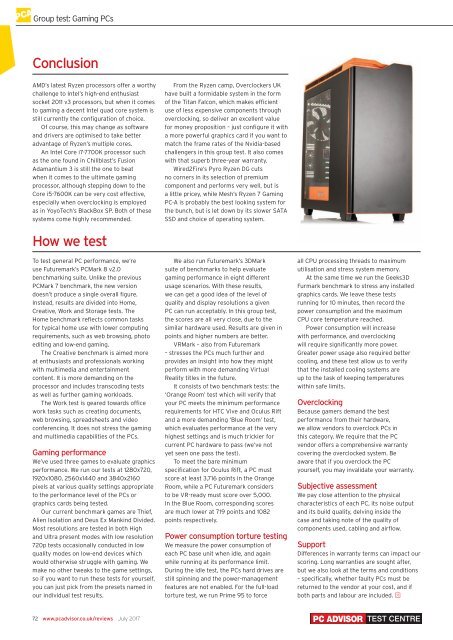
Group test: Gaming <strong>PC</strong>s<br />
Conclusion<br />
AMD’s latest Ryzen processors offer a worthy<br />
challenge to Intel’s high-end enthusiast<br />
socket 2011 v3 processors, but when it comes<br />
to gaming a decent Intel quad core system is<br />
still currently the configuration of choice.<br />
Of course, this may change as software<br />
and drivers are optimised to take better<br />
advantage of Ryzen’s multiple cores.<br />
An Intel Core i7-7700K processor such<br />
as the one found in Chillblast’s Fusion<br />
Adamantium 3 is still the one to beat<br />
when it comes to the ultimate gaming<br />
processor, although stepping down to the<br />
Core i5-7600K can be very cost effective,<br />
especially when overclocking is employed<br />
as in YoyoTech’s BlackBox SP. Both of these<br />
systems come highly recommended.<br />
From the Ryzen camp, Overclockers UK<br />
have built a formidable system in the form<br />
of the Titan Falcon, which makes efficient<br />
use of less expensive components through<br />
overclocking, so deliver an excellent value<br />
for money proposition – just configure it with<br />
a more powerful graphics card if you want to<br />
match the frame rates of the Nvidia-based<br />
challengers in this group test. It also comes<br />
with that superb three-year warranty.<br />
Wired2Fire’s Pyro Ryzen DG cuts<br />
no corners in its selection of premium<br />
component and performs very well, but is<br />
a little pricey, while Mesh’s Ryzen 7 Gaming<br />
<strong>PC</strong>-A is probably the best looking system for<br />
the bunch, but is let down by its slower SATA<br />
SSD and choice of operating system.<br />
How we test<br />
To test general <strong>PC</strong> performance, we’re<br />
use Futuremark’s <strong>PC</strong>Mark 8 v2.0<br />
benchmarking suite. Unlike the previous<br />
<strong>PC</strong>Mark 7 benchmark, the new version<br />
doesn’t produce a single overall figure.<br />
Instead, results are divided into Home,<br />
Creative, Work and Storage tests. The<br />
Home benchmark reflects common tasks<br />
for typical home use with lower computing<br />
requirements, such as web browsing, photo<br />
editing and low-end gaming.<br />
The Creative benchmark is aimed more<br />
at enthusiasts and professionals working<br />
with multimedia and entertainment<br />
content. It is more demanding on the<br />
processor and includes transcoding tests<br />
as well as further gaming workloads.<br />
The Work test is geared towards office<br />
work tasks such as creating documents,<br />
web browsing, spreadsheets and video<br />
conferencing. It does not stress the gaming<br />
and multimedia capabilities of the <strong>PC</strong>s.<br />
Gaming performance<br />
We’ve used three games to evaluate graphics<br />
performance. We run our tests at 1280x720,<br />
1920x1080, 2560x1440 and 3840x2160<br />
pixels at various quality settings appropriate<br />
to the performance level of the <strong>PC</strong>s or<br />
graphics cards being tested.<br />
Our current benchmark games are Thief,<br />
Alien Isolation and Deus Ex Mankind Divided.<br />
Most resolutions are tested in both High<br />
and Ultra present modes with low resolution<br />
720p tests occasionally conducted in low<br />
quality modes on low-end devices which<br />
would otherwise struggle with gaming. We<br />
make no other tweaks to the game settings,<br />
so if you want to run these tests for yourself,<br />
you can just pick from the presets named in<br />
our individual test results.<br />
We also run Futuremark’s 3DMark<br />
suite of benchmarks to help evaluate<br />
gaming performance in eight different<br />
usage scenarios. With these results,<br />
we can get a good idea of the level of<br />
quality and display resolutions a given<br />
<strong>PC</strong> can run acceptably. In this group test,<br />
the scores are all very close, due to the<br />
similar hardware used. Results are given in<br />
points and higher numbers are better.<br />
VRMark – also from Futuremark<br />
– stresses the <strong>PC</strong>s much further and<br />
provides an insight into how they might<br />
perform with more demanding Virtual<br />
Reality titles in the future.<br />
It consists of two benchmark tests: the<br />
‘Orange Room’ test which will verify that<br />
your <strong>PC</strong> meets the minimum performance<br />
requirements for HTC Vive and Oculus Rift<br />
and a more demanding ‘Blue Room’ test,<br />
which evaluates performance at the very<br />
highest settings and is much trickier for<br />
current <strong>PC</strong> hardware to pass (we’ve not<br />
yet seen one pass the test).<br />
To meet the bare minimum<br />
specification for Oculus Rift, a <strong>PC</strong> must<br />
score at least 3,716 points in the Orange<br />
Room, while a <strong>PC</strong> Futuremark considers<br />
to be VR-ready must score over 5,000.<br />
In the Blue Room, corresponding scores<br />
are much lower at 719 points and 1082<br />
points respectively.<br />
Power consumption torture testing<br />
We measure the power consumption of<br />
each <strong>PC</strong> base unit when idle, and again<br />
while running at its performance limit.<br />
During the idle test, the <strong>PC</strong>s hard drives are<br />
still spinning and the power-management<br />
features are not enabled. For the full-load<br />
torture test, we run Prime 95 to force<br />
all CPU processing threads to maximum<br />
utilisation and stress system memory.<br />
At the same time we run the Geeks3D<br />
Furmark benchmark to stress any installed<br />
graphics cards. We leave these tests<br />
running for 10 minutes, then record the<br />
power consumption and the maximum<br />
CPU core temperature reached.<br />
Power consumption will increase<br />
with performance, and overclocking<br />
will require significantly more power.<br />
Greater power usage also required better<br />
cooling, and these test allow us to verify<br />
that the installed cooling systems are<br />
up to the task of keeping temperatures<br />
within safe limits.<br />
Overclocking<br />
Because gamers demand the best<br />
performance from their hardware,<br />
we allow vendors to overclock <strong>PC</strong>s in<br />
this category. We require that the <strong>PC</strong><br />
vendor offers a comprehensive warranty<br />
covering the overclocked system. Be<br />
aware that if you overclock the <strong>PC</strong><br />
yourself, you may invalidate your warranty.<br />
Subjective assessment<br />
We pay close attention to the physical<br />
characteristics of each <strong>PC</strong>, its noise output<br />
and its build quality, delving inside the<br />
case and taking note of the quality of<br />
components used, cabling and airflow.<br />
Support<br />
Differences in warranty terms can impact our<br />
scoring. Long warranties are sought after,<br />
but we also look at the terms and conditions<br />
– specifically, whether faulty <strong>PC</strong>s must be<br />
returned to the vendor at your cost, and if<br />
both parts and labour are included. J<br />
72 www.pcadvisor.co.uk/reviews <strong>July</strong> <strong>2017</strong><br />
TEST CENTRE