atw - International Journal for Nuclear Power | 6.2023
Reaktorkonzepte und neue Entwicklungen
Reaktorkonzepte und neue Entwicklungen

Create successful ePaper yourself
Turn your PDF publications into a flip-book with our unique Google optimized e-Paper software.
<strong>atw</strong> Vol. 68 (2023) | Ausgabe 6 ı November<br />
WELL<br />
SUITED<br />
HOW WELL SUITED<br />
IS THIS<br />
TECHNOLOGY TO<br />
DEPLOYMENT AT<br />
SCALE TO SUPPORT<br />
GLOBAL<br />
DECARBONISATION?<br />
POORLY<br />
SUITED<br />
5<br />
0<br />
-5<br />
NOT<br />
VIABLE<br />
N=5 RISK POINT<br />
N=0 RISK POINT<br />
N=-5 RISK POINT<br />
FUSION<br />
-5<br />
-5<br />
SMRs<br />
-5<br />
LARGE<br />
GW<br />
LEARNING CURVE<br />
-5<br />
HOW VIABLE IS THIS<br />
TECHNOLOGY TO BEING<br />
DEPLOYED AT SCALE?<br />
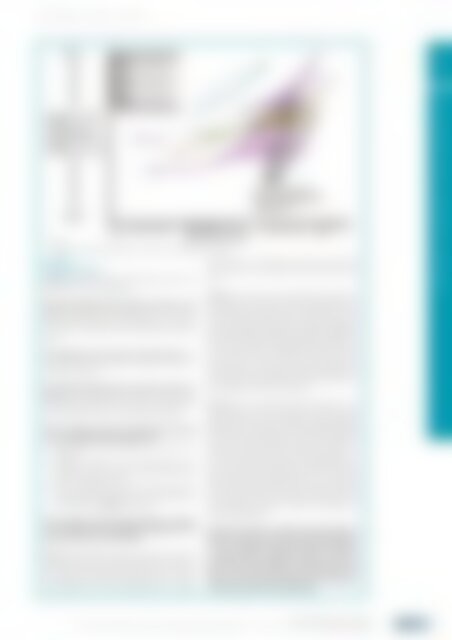
| Fig. 1<br />
Progress of Technologies mapped against modelled scores of SUITABILITY and VIABILITY.<br />
LEGEND 1<br />
Analysis of Figure 1<br />
Figure 1 shows four lines, each denoting the range of total<br />
scores <strong>for</strong> each technology group.<br />
The left hand/lower end of each line is the N= –5 risk<br />
point. This illustrates the most pessimistic score: where the<br />
less viable examples of the technology are now, or where<br />
the majority of examples were around five years ago or<br />
more.<br />
The middle point on each line is the N= 0 point. This<br />
illustrates where we assess good examples of each technology<br />
are at present.<br />
The right hand/upper point on each line is the N= +5<br />
point, where we estimate that the best examples of each<br />
technology could be in the next five years, in an optimistic<br />
scenario, based on ef<strong>for</strong>ts we see being made today.<br />
We can interpret the lines as representing a learning<br />
curve, mapping potential progress from<br />
p higher to lower commercial/delivery risk (X-axis left to<br />
right) and<br />
p increasing confidence that the technology can be<br />
deployed at a scale to make a contribution to Net Zero<br />
goals (Y-axis bottom to top).<br />
p So <strong>for</strong> a technology to be (a) commercially viable and<br />
(b) deployable at a required scale, it should be as close<br />
to the top right of Figure 1 as possible.<br />
The triangular coloured regions illustrate the likely<br />
area into which each technology will progress to if today’s<br />
promise does not materialize.<br />
At N= –5, large GW technology is closest to the top right,<br />
showing that a few years ago, large GW plants were most<br />
likely to be the technology of choice, but even so still came<br />
with significant risk. Fusion technology at N=-5 is nearest<br />
to the bottom left corner, reflecting its lack of concept<br />
0<br />
0<br />
0<br />
0<br />
FUSION<br />
LARGE<br />
GW<br />
SMRs<br />
THE LIKELY AREA INTO<br />
WHICH THIS TECHNOLOGY<br />
WILL PROGRESS IF TODAY’S<br />
PROMISE DOES NOT<br />
MATERIALIZE<br />
5<br />
5<br />
5<br />
5<br />
COMMERCIALLY<br />
VIABLE<br />
demonstration or scalability at that point; some of the<br />
more esoteric fusion concepts may still be around this<br />
point.<br />
At N= 0, the chart shows our assessment of risk and scalability<br />
today. Our scores show that, whilst large GW technology<br />
has regained confidence over the past few years, SMR<br />
and AR technology have caught up, reflecting increased<br />
policy and market confidence in the viability and scalability<br />
of these technologies. Indeed, the position of SMRs and<br />
ARs further up the Y-axis compared to large GW recognizes<br />
the wider potential <strong>for</strong> deployment at scale <strong>for</strong> these<br />
types of reactor. Fusion at N= 0 is still somewhat further<br />
to the bottom left, illustrating that the technology, despite<br />
its potential, still has to generate credibility to be seen as a<br />
viable scalable contribution to Net Zero.<br />
At N= +5, we see a significant potential change in comparative<br />
position of the technologies. Fusion has rapidly<br />
gained in both commercial confidence and demonstrable<br />
scalability and is now closest to the top right, signifying<br />
that of all the technologies this could have the greatest<br />
commercial viability and ability to deploy at scale to provide<br />
the energy contribution to Net Zero goals. ARs are a<br />
close second, having continued to surpass SMR technology<br />
as the expected AR advantages become increasingly<br />
demonstrable and confidence grows in use and per<strong>for</strong>mance<br />
of the advanced coolants and materials. Large GW<br />
technology has continued to advance but capital cost and<br />
public sentiment continues to hamper the feasibility of<br />
large-scale deployment.<br />
However, since the N= +5 points are the most favorable<br />
future outcomes, based on our professional judgement,<br />
the triangular area below the lines shows there<br />
is a broad range of possible outcomes in practice,<br />
depending on actual progress achieved in the critical<br />
Issues – with most scenarios <strong>for</strong> all technologies not<br />
achieving the necessary breakthrough. This demonstrates<br />
the need <strong>for</strong> careful monitoring.<br />
FEATURE | RESEARCH AUS DEN AND UNTERNEHMEN<br />
INNOVATION 11<br />
Feature Research and Innovation<br />
The Future of <strong>Nuclear</strong>: How Will Fission and Fusion Technologies Help Us Reach Net Zero Emissions? ı Ruediger Koenig and John Warden, with Aus a panel den of Unternehmen<br />
experts from NECG