

The Economics of Desertification, Land Degradation, and Drought
The Economics of Desertification, Land Degradation, and Drought
The Economics of Desertification, Land Degradation, and Drought

Create successful ePaper yourself
Turn your PDF publications into a flip-book with our unique Google optimized e-Paper software.
those that affect economic plant yields, similar to those used for the 1983 assessment. Results indicate<br />
70 percent l<strong>and</strong> degradation <strong>of</strong> the assessed l<strong>and</strong>. Although estimates are considerably better than the<br />
1983 estimates, the database <strong>and</strong> information upon which calculations were made were still poor, with<br />
an upward bias.<br />
Global Assessment <strong>of</strong> Human-Induced Soil <strong>Degradation</strong> by the International Soil<br />
Reference <strong>and</strong> Information Centre (1987–1990)<br />
<strong>The</strong> Global Assessment <strong>of</strong> Human-Induced <strong>L<strong>and</strong></strong> <strong>Degradation</strong> (GLASOD) study, which was carried<br />
out by the World Soil Information Center <strong>and</strong> commissioned by the United Nations Environment<br />
Program (UNEP) between 1987 <strong>and</strong> 1995, was the first major global assessment <strong>of</strong> soil degradation.<br />
<strong>The</strong> project represented “the basis <strong>of</strong> the most recent UN studies <strong>of</strong> global l<strong>and</strong> degradation <strong>and</strong><br />
desertification” (Thomas <strong>and</strong> Middleton 1996: 119). Within three years (by 1990), GLASOD<br />
developed a world map <strong>of</strong> human-induced soil degradation (Oldeman, Hakkeling, <strong>and</strong> Sombroek<br />
1991b). <strong>The</strong> approach defines soil degradation as “human-induced phenomena, which lower the<br />
current <strong>and</strong>/or future capacity <strong>of</strong> the soil to support human life” (UNEP 1997b). <strong>The</strong> map was<br />
originally produced for the United Nations Conference on Environment <strong>and</strong> Development (UNCED)<br />
in 1992.<br />
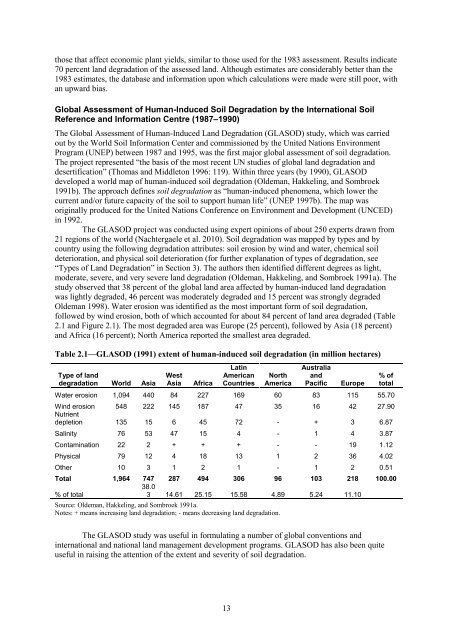
<strong>The</strong> GLASOD project was conducted using expert opinions <strong>of</strong> about 250 experts drawn from<br />
21 regions <strong>of</strong> the world (Nachtergaele et al. 2010). Soil degradation was mapped by types <strong>and</strong> by<br />
country using the following degradation attributes: soil erosion by wind <strong>and</strong> water, chemical soil<br />
deterioration, <strong>and</strong> physical soil deterioration (for further explanation <strong>of</strong> types <strong>of</strong> degradation, see<br />
“Types <strong>of</strong> <strong>L<strong>and</strong></strong> <strong>Degradation</strong>” in Section 3). <strong>The</strong> authors then identified different degrees as light,<br />
moderate, severe, <strong>and</strong> very severe l<strong>and</strong> degradation (Oldeman, Hakkeling, <strong>and</strong> Sombroek 1991a). <strong>The</strong><br />
study observed that 38 percent <strong>of</strong> the global l<strong>and</strong> area affected by human-induced l<strong>and</strong> degradation<br />
was lightly degraded, 46 percent was moderately degraded <strong>and</strong> 15 percent was strongly degraded<br />
Oldeman 1998). Water erosion was identified as the most important form <strong>of</strong> soil degradation,<br />
followed by wind erosion, both <strong>of</strong> which accounted for about 84 percent <strong>of</strong> l<strong>and</strong> area degraded (Table<br />
2.1 <strong>and</strong> Figure 2.1). <strong>The</strong> most degraded area was Europe (25 percent), followed by Asia (18 percent)<br />
<strong>and</strong> Africa (16 percent); North America reported the smallest area degraded.<br />
Table 2.1—GLASOD (1991) extent <strong>of</strong> human-induced soil degradation (in million hectares)<br />
Type <strong>of</strong> l<strong>and</strong><br />
degradation World Asia<br />
West<br />
Asia Africa<br />
Latin<br />
American<br />
Countries<br />
13<br />
North<br />
America<br />
Australia<br />
<strong>and</strong><br />
Pacific Europe<br />
% <strong>of</strong><br />
total<br />
Water erosion 1,094 440 84 227 169 60 83 115 55.70<br />
Wind erosion<br />
Nutrient<br />
548 222 145 187 47 35 16 42 27.90<br />
depletion 135 15 6 45 72 - + 3 6.87<br />
Salinity 76 53 47 15 4 - 1 4 3.87<br />
Contamination 22 2 + + + - - 19 1.12<br />
Physical 79 12 4 18 13 1 2 36 4.02<br />
Other 10 3 1 2 1 - 1 2 0.51<br />
Total 1,964 747<br />
38.0<br />
287 494 306 96 103 218 100.00<br />
% <strong>of</strong> total<br />
3 14.61 25.15 15.58 4.89 5.24 11.10<br />
Source: Oldeman, Hakkeling, <strong>and</strong> Sombroek 1991a.<br />
Notes: + means increasing l<strong>and</strong> degradation; - means decreasing l<strong>and</strong> degradation.<br />
<strong>The</strong> GLASOD study was useful in formulating a number <strong>of</strong> global conventions <strong>and</strong><br />
international <strong>and</strong> national l<strong>and</strong> management development programs. GLASOD has also been quite<br />
useful in raising the attention <strong>of</strong> the extent <strong>and</strong> severity <strong>of</strong> soil degradation.


