

The Economics of Desertification, Land Degradation, and Drought
The Economics of Desertification, Land Degradation, and Drought
The Economics of Desertification, Land Degradation, and Drought

You also want an ePaper? Increase the reach of your titles
YUMPU automatically turns print PDFs into web optimized ePapers that Google loves.
was started in reaction to the GLASOD approach, in order to develop “a set tools to document,<br />
monitor, <strong>and</strong> evaluate” soil <strong>and</strong> water conservation (SWC) “know-how, to disseminate it around the<br />
globe, <strong>and</strong> to facilitate the exchange <strong>of</strong> experience” (Schwilch, Liniger, <strong>and</strong> Van Lynden 2004: 1). It<br />
was aimed at facilitating local <strong>and</strong> international exchange <strong>of</strong> knowledge by establishing the WOCAT<br />
network. A global map <strong>of</strong> SWC measures is still under construction. WOCAT also collected data on<br />
the costs <strong>of</strong> l<strong>and</strong> management practices, which could allow a determination <strong>of</strong> the costs <strong>of</strong> taking<br />
action to prevent or mitigate l<strong>and</strong> degradation. WOCAT conducted 42 case studies in 23 countries<br />
from six continents. However, the choice <strong>of</strong> the case study countries was not done in such a way that<br />
could allow extrapolation <strong>of</strong> the results to the rest <strong>of</strong> the world.<br />
Global <strong>Desertification</strong> Tension Zones<br />
<strong>The</strong> U.S. Department <strong>of</strong> Agriculture’s Natural Resources Conservation Service (NRCS) developed<br />
global maps on global desertification tension zones, which depict areas vulnerable to desertification,<br />
wind <strong>and</strong> water erosion by natural preconditions, <strong>and</strong> human impact (Eswaran, Lal, <strong>and</strong> Reich 2001).<br />
<strong>Desertification</strong> tension zones were described with two systems: zones under low-input agricultural<br />
systems, where the “productive capacity <strong>of</strong> the l<strong>and</strong> is stressed by mismanagement, generally by<br />
resource poor farmers,” <strong>and</strong> high-input agricultural systems, where tension zones “arise due to<br />
excessive use <strong>of</strong> agrochemicals, uncontrolled use <strong>of</strong> irrigation, <strong>and</strong> monoclonal plantations with<br />
minimal genetic diversity” (Eswaran, Reich, <strong>and</strong> Beinroth 1998: 1). Four degrees <strong>of</strong> severity (low,<br />
moderate, high, <strong>and</strong> very high), reminiscent to the GLASOD approach, show the degree <strong>of</strong> an area’s<br />
vulnerability to desertification or l<strong>and</strong> degradation (Figure 2.2). According to the definition <strong>of</strong><br />
desertification from UNEP, only arid, semiarid, <strong>and</strong> subhumid areas were integrated in this approach,<br />
excluding subhumid <strong>and</strong> humid, except for water erosion, which also affects humid areas.<br />
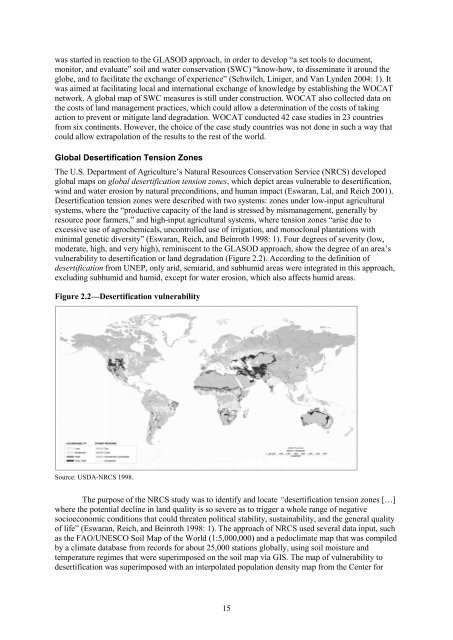
Figure 2.2—<strong>Desertification</strong> vulnerability<br />
Source: USDA-NRCS 1998.<br />
<strong>The</strong> purpose <strong>of</strong> the NRCS study was to identify <strong>and</strong> locate “desertification tension zones […]<br />
where the potential decline in l<strong>and</strong> quality is so severe as to trigger a whole range <strong>of</strong> negative<br />
socioeconomic conditions that could threaten political stability, sustainability, <strong>and</strong> the general quality<br />
<strong>of</strong> life” (Eswaran, Reich, <strong>and</strong> Beinroth 1998: 1). <strong>The</strong> approach <strong>of</strong> NRCS used several data input, such<br />
as the FAO/UNESCO Soil Map <strong>of</strong> the World (1:5,000,000) <strong>and</strong> a pedoclimate map that was compiled<br />
by a climate database from records for about 25,000 stations globally, using soil moisture <strong>and</strong><br />
temperature regimes that were superimposed on the soil map via GIS. <strong>The</strong> map <strong>of</strong> vulnerability to<br />
desertification was superimposed with an interpolated population density map from the Center for<br />
15


