- Page 1 and 2: IFPRI Discussion Paper 01086 May 20
- Page 3 and 4: Contents Abstract vii Acknowledgmen
- Page 5 and 6: List of Figures 1.1—Conceptual fr
- Page 7 and 8: ABSTRACT Attention to land degradat
- Page 9 and 10: ABBREVIATIONS AND ACRONYMS ADB Asia
- Page 11: SCAR Soil Conservation in Agricultu
- Page 14 and 15: In the present report, the conceptu
- Page 16 and 17: Framework: Confronting Action versu
- Page 18 and 19: understand these arrangements in or
- Page 20 and 21: Figure 1.3—Prevention, mitigation
- Page 22 and 23: on assessments at the micro level (
- Page 24 and 25: does not clearly distinguish betwee
- Page 26 and 27: Figure 2.1—GLASOD (1991) global a
- Page 28 and 29: International Earth Science Informa
- Page 30 and 31: Box 2.1—Continued Normalized Diff
- Page 32 and 33: Figure 2.4—Loss of annual NPP, GL
- Page 34 and 35: Figure 2.7—Annual loss of NPP in
- Page 36 and 37: Table 2.2—Nitrogen application ra
- Page 38 and 39: Figure 2.12—Areas affected by hum
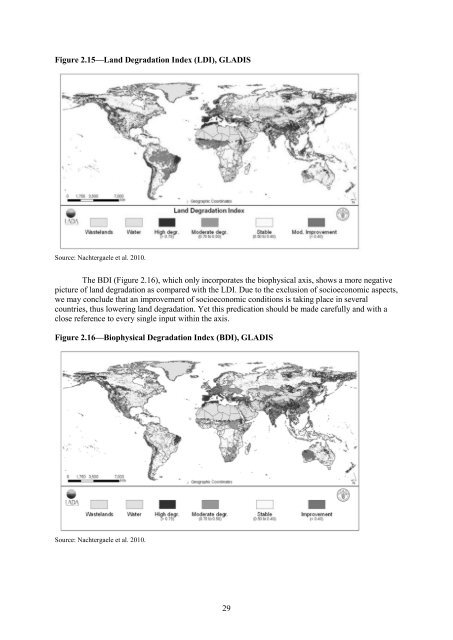
- Page 42 and 43: GLADIS also underlines the linkage
- Page 44 and 45: Box 2.2—Continued A map on global
- Page 46 and 47: Table 2.3—Global land degradation
- Page 48 and 49: Table 2.3—Continued Project and d
- Page 50 and 51: Table 2.4—Continued Location 10 2
- Page 52 and 53: Table 2.6—Extent and severity of
- Page 54 and 55: National Level Policies As discusse
- Page 56 and 57: Such support has also been directed
- Page 58 and 59: Migration, either as outmigration o
- Page 60 and 61: The preceding discussion shows the
- Page 62 and 63: Results Correlation Analysis Consis
- Page 64 and 65: Figure 2.23—Relationship between
- Page 66 and 67: Effects of Land Degradation On-Site
- Page 68 and 69: soils and higher land productivity.
- Page 70 and 71: Acknowledging the work of GLADIS, a
- Page 72 and 73: health, education, security, enviro
- Page 74 and 75: Box 3.1—Recent major economic ass
- Page 76 and 77: An appropriate economic tool for a
- Page 78 and 79: Figure 3.4—Cost of action and cos
- Page 80 and 81: enefit—for example, income. This
- Page 82 and 83: Figure 3.6—Ecosystem services fra
- Page 84 and 85: Replacement Cost Approaches The rep
- Page 86 and 87: Box 3.2—Measuring land degradatio
- Page 88 and 89: land degradation and conservation m
- Page 90 and 91:
Flooding and Aquifer Recharge Richa
- Page 92 and 93:
year (Diao and Sarpong 2007). Sonne
- Page 94 and 95:
Bringing together the different cos
- Page 96 and 97:
This section discusses the most imp
- Page 98 and 99:
governing land use patterns (Leeman
- Page 100 and 101:
promotion of community forest manag
- Page 102 and 103:
Box 4.3—Reducing emissions from d
- Page 104 and 105:
Soil Nutrient Depletion Soil nutrie
- Page 106 and 107:
that the yields of salt-tolerant wh
- Page 108 and 109:
Figure 5.3—Forest area as a perce
- Page 110 and 111:
Figure 5.5—Per capita water stora
- Page 112 and 113:
Introduction 6. CASE STUDIES Five c
- Page 114 and 115:
Salinity The effects of salinity on
- Page 116 and 117:
Third, to correctly decide which ac
- Page 118 and 119:
Costs of Action and Inaction We eva
- Page 120 and 121:
The NGOs and religious organization
- Page 122 and 123:
have a strong influence on NRM (And
- Page 124 and 125:
We estimated the cost of action (de
- Page 126 and 127:
Figure 6.15—Costs of action and i
- Page 128 and 129:
Of interest to us is the strategy t
- Page 130 and 131:
7. PARTNERSHIP CONCEPT The review o
- Page 132 and 133:
degradation. All this should be don
- Page 134 and 135:
Finally, the global assessment of D
- Page 136 and 137:
the experience of and lessons learn
- Page 138 and 139:
Table 7.3—Example of E-DLDD resea
- Page 140 and 141:
8. CONCLUSIONS Since the publicatio
- Page 142 and 143:
lowest in the region. From a socioe
- Page 144 and 145:
Table A.1—Land degradation assess
- Page 146 and 147:
Table A.2—Continued Author Region
- Page 148 and 149:
Table A.3—Continued Author Countr
- Page 150 and 151:
Table A.3—Continued Author Countr
- Page 152 and 153:
Table A.4—Continued Author Countr
- Page 154 and 155:
Table A.4—Continued Author Countr
- Page 156 and 157:
Table A.5—Costs of land degradati
- Page 158 and 159:
Figure B.1—Land use systems of th
- Page 160 and 161:
REFERENCES Abelson, P. 1979. Cost B
- Page 162 and 163:
Benin S., E. Nkonya, G. Okecho, J.
- Page 164 and 165:
Clark, E. H. 1985. The Off-Site Cos
- Page 166 and 167:
De Jager a., D. Onduru and C. Walag
- Page 168 and 169:
Foster, V., and C. Briceño-Garmend
- Page 170 and 171:
Holden, S. and H. Lofgren. 2005. As
- Page 172 and 173:
Lapar, M. L., and S. Pandey. 1999.
- Page 174 and 175:
Nachtergaele, F., M. Petri, R. Bian
- Page 176 and 177:
Pender, J. L. 2009. “Food Crisis
- Page 178 and 179:
Sauer, J., and H. Tchale. 2006. Alt
- Page 180 and 181:
Tan, Z. X., R. Lal, and K. D. Wiebe
- Page 182 and 183:
———. 2010. “Assessment of L
- Page 187 and 188:
RECENT IFPRI DISCUSSION PAPERS For